Runs 100% locally — no cloud or subscription required
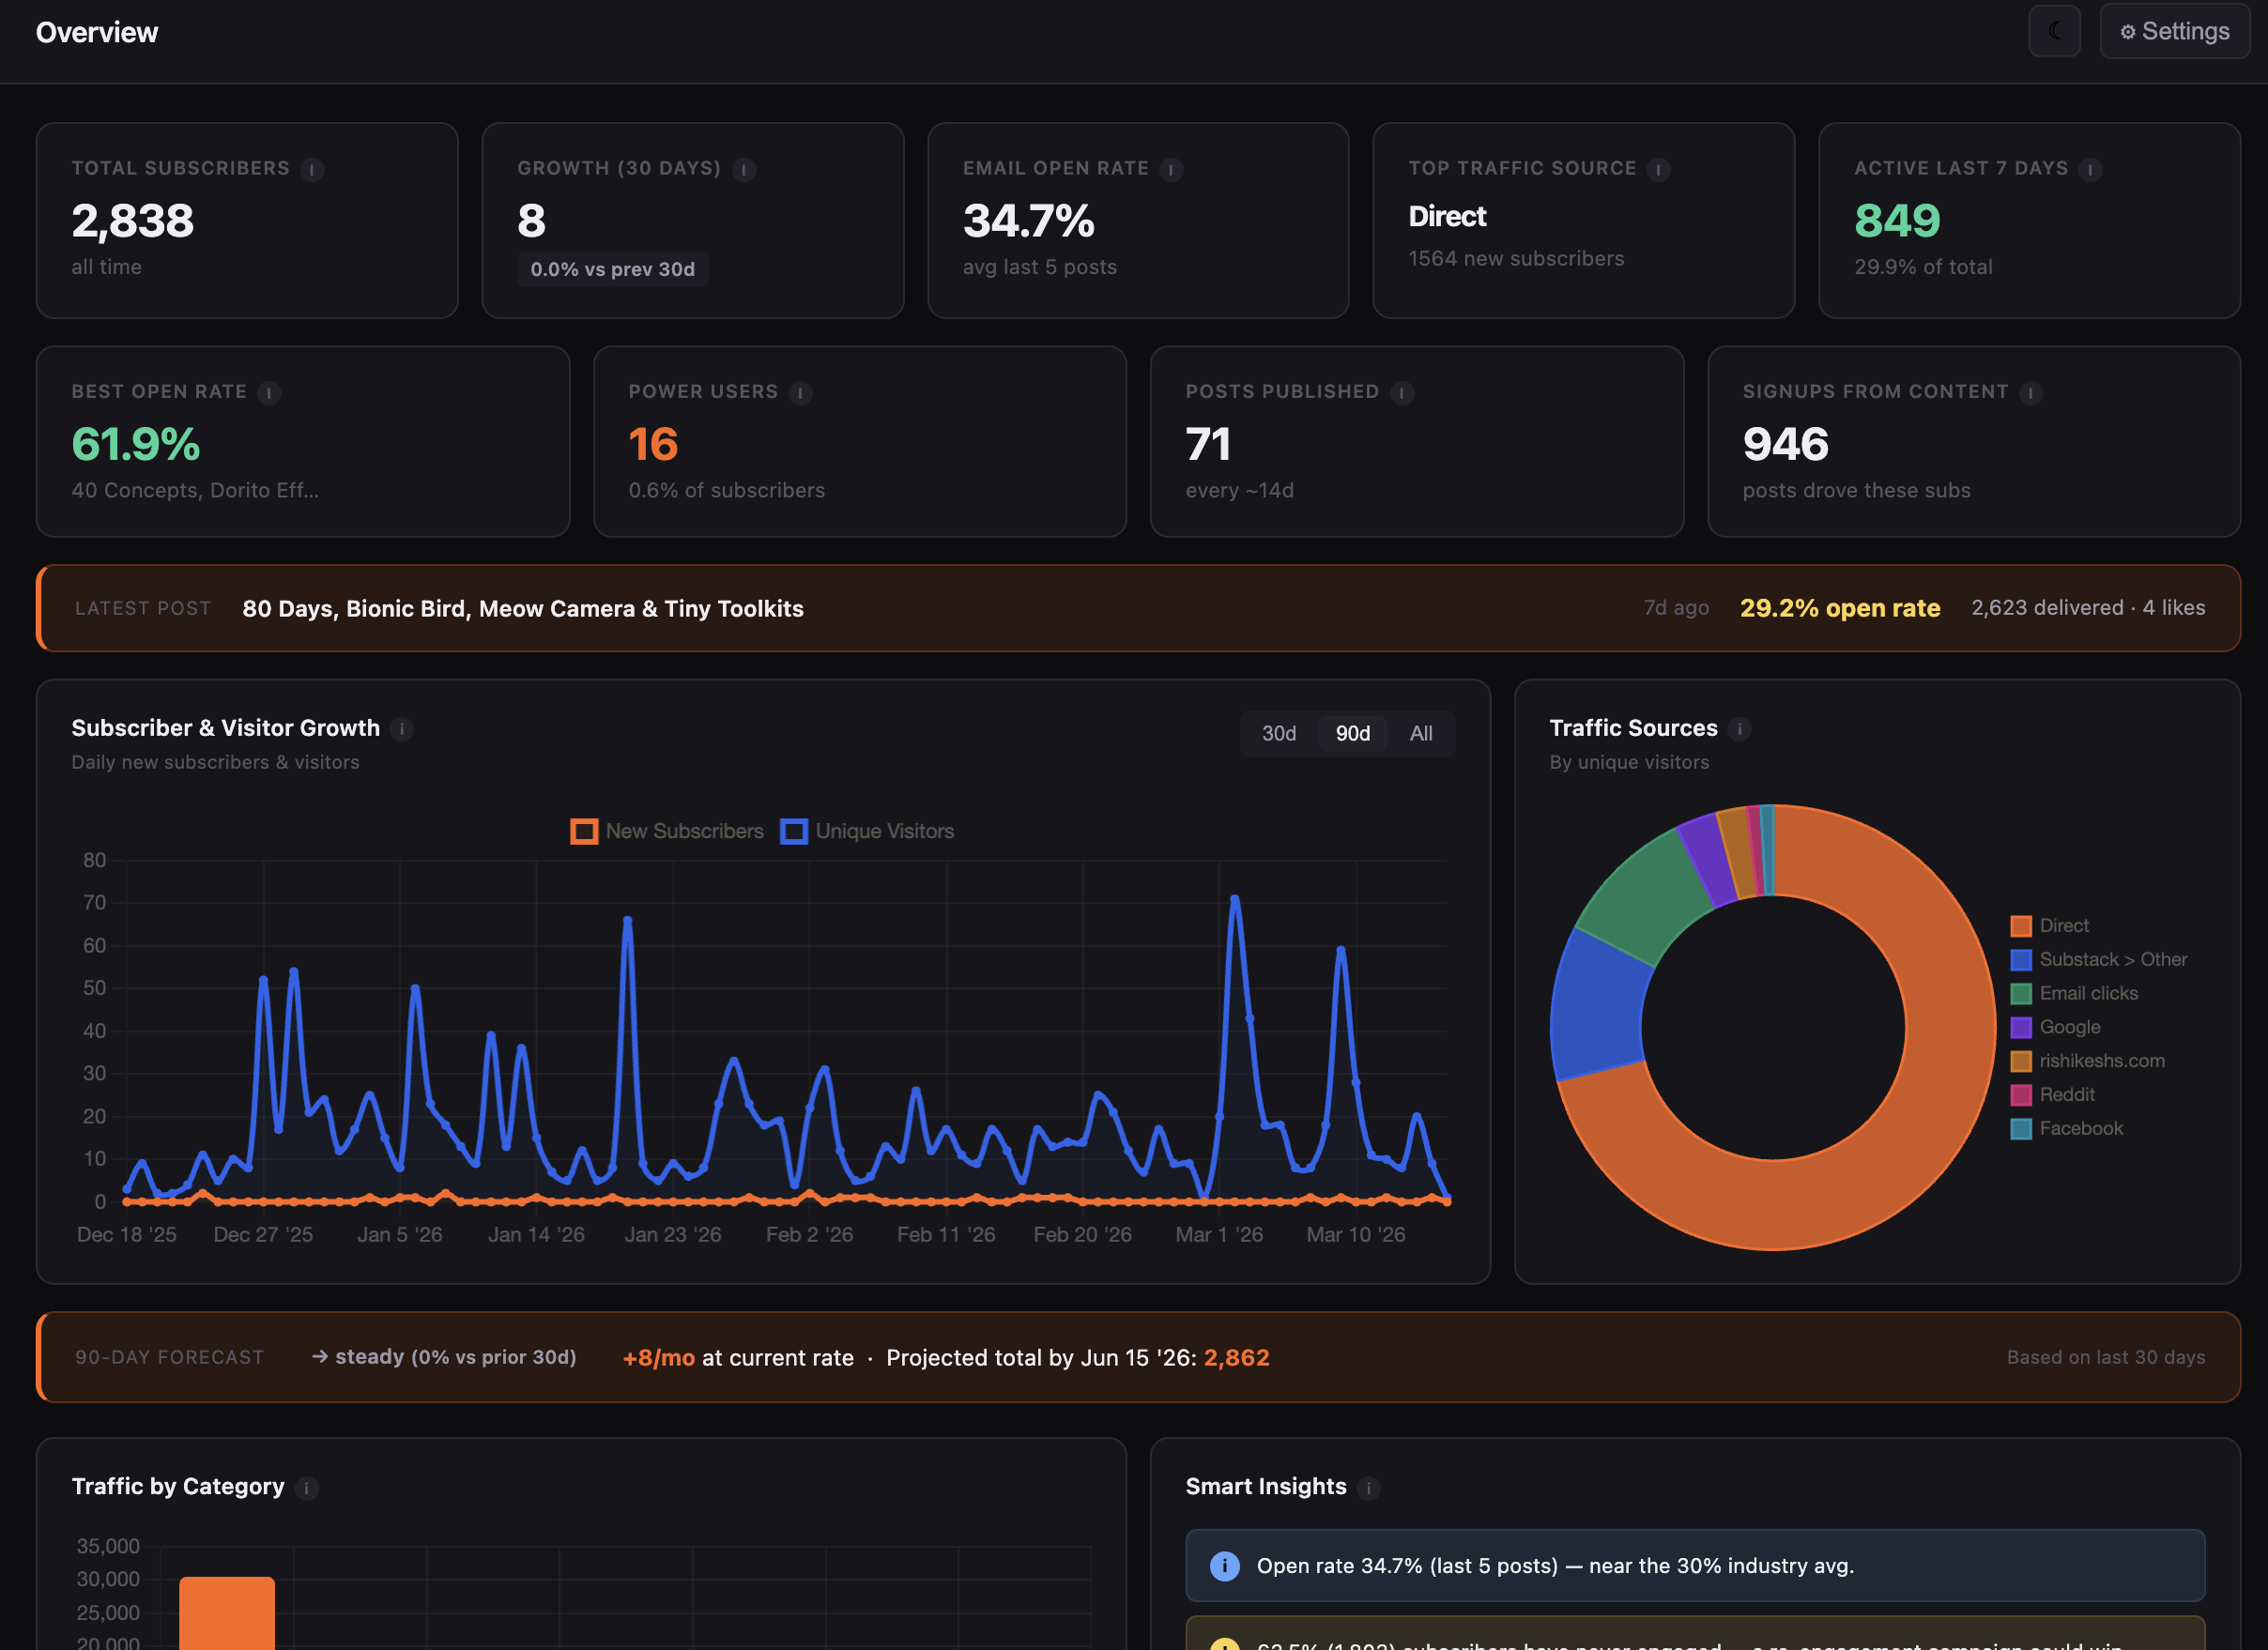
Better analytics for
your Substack™.
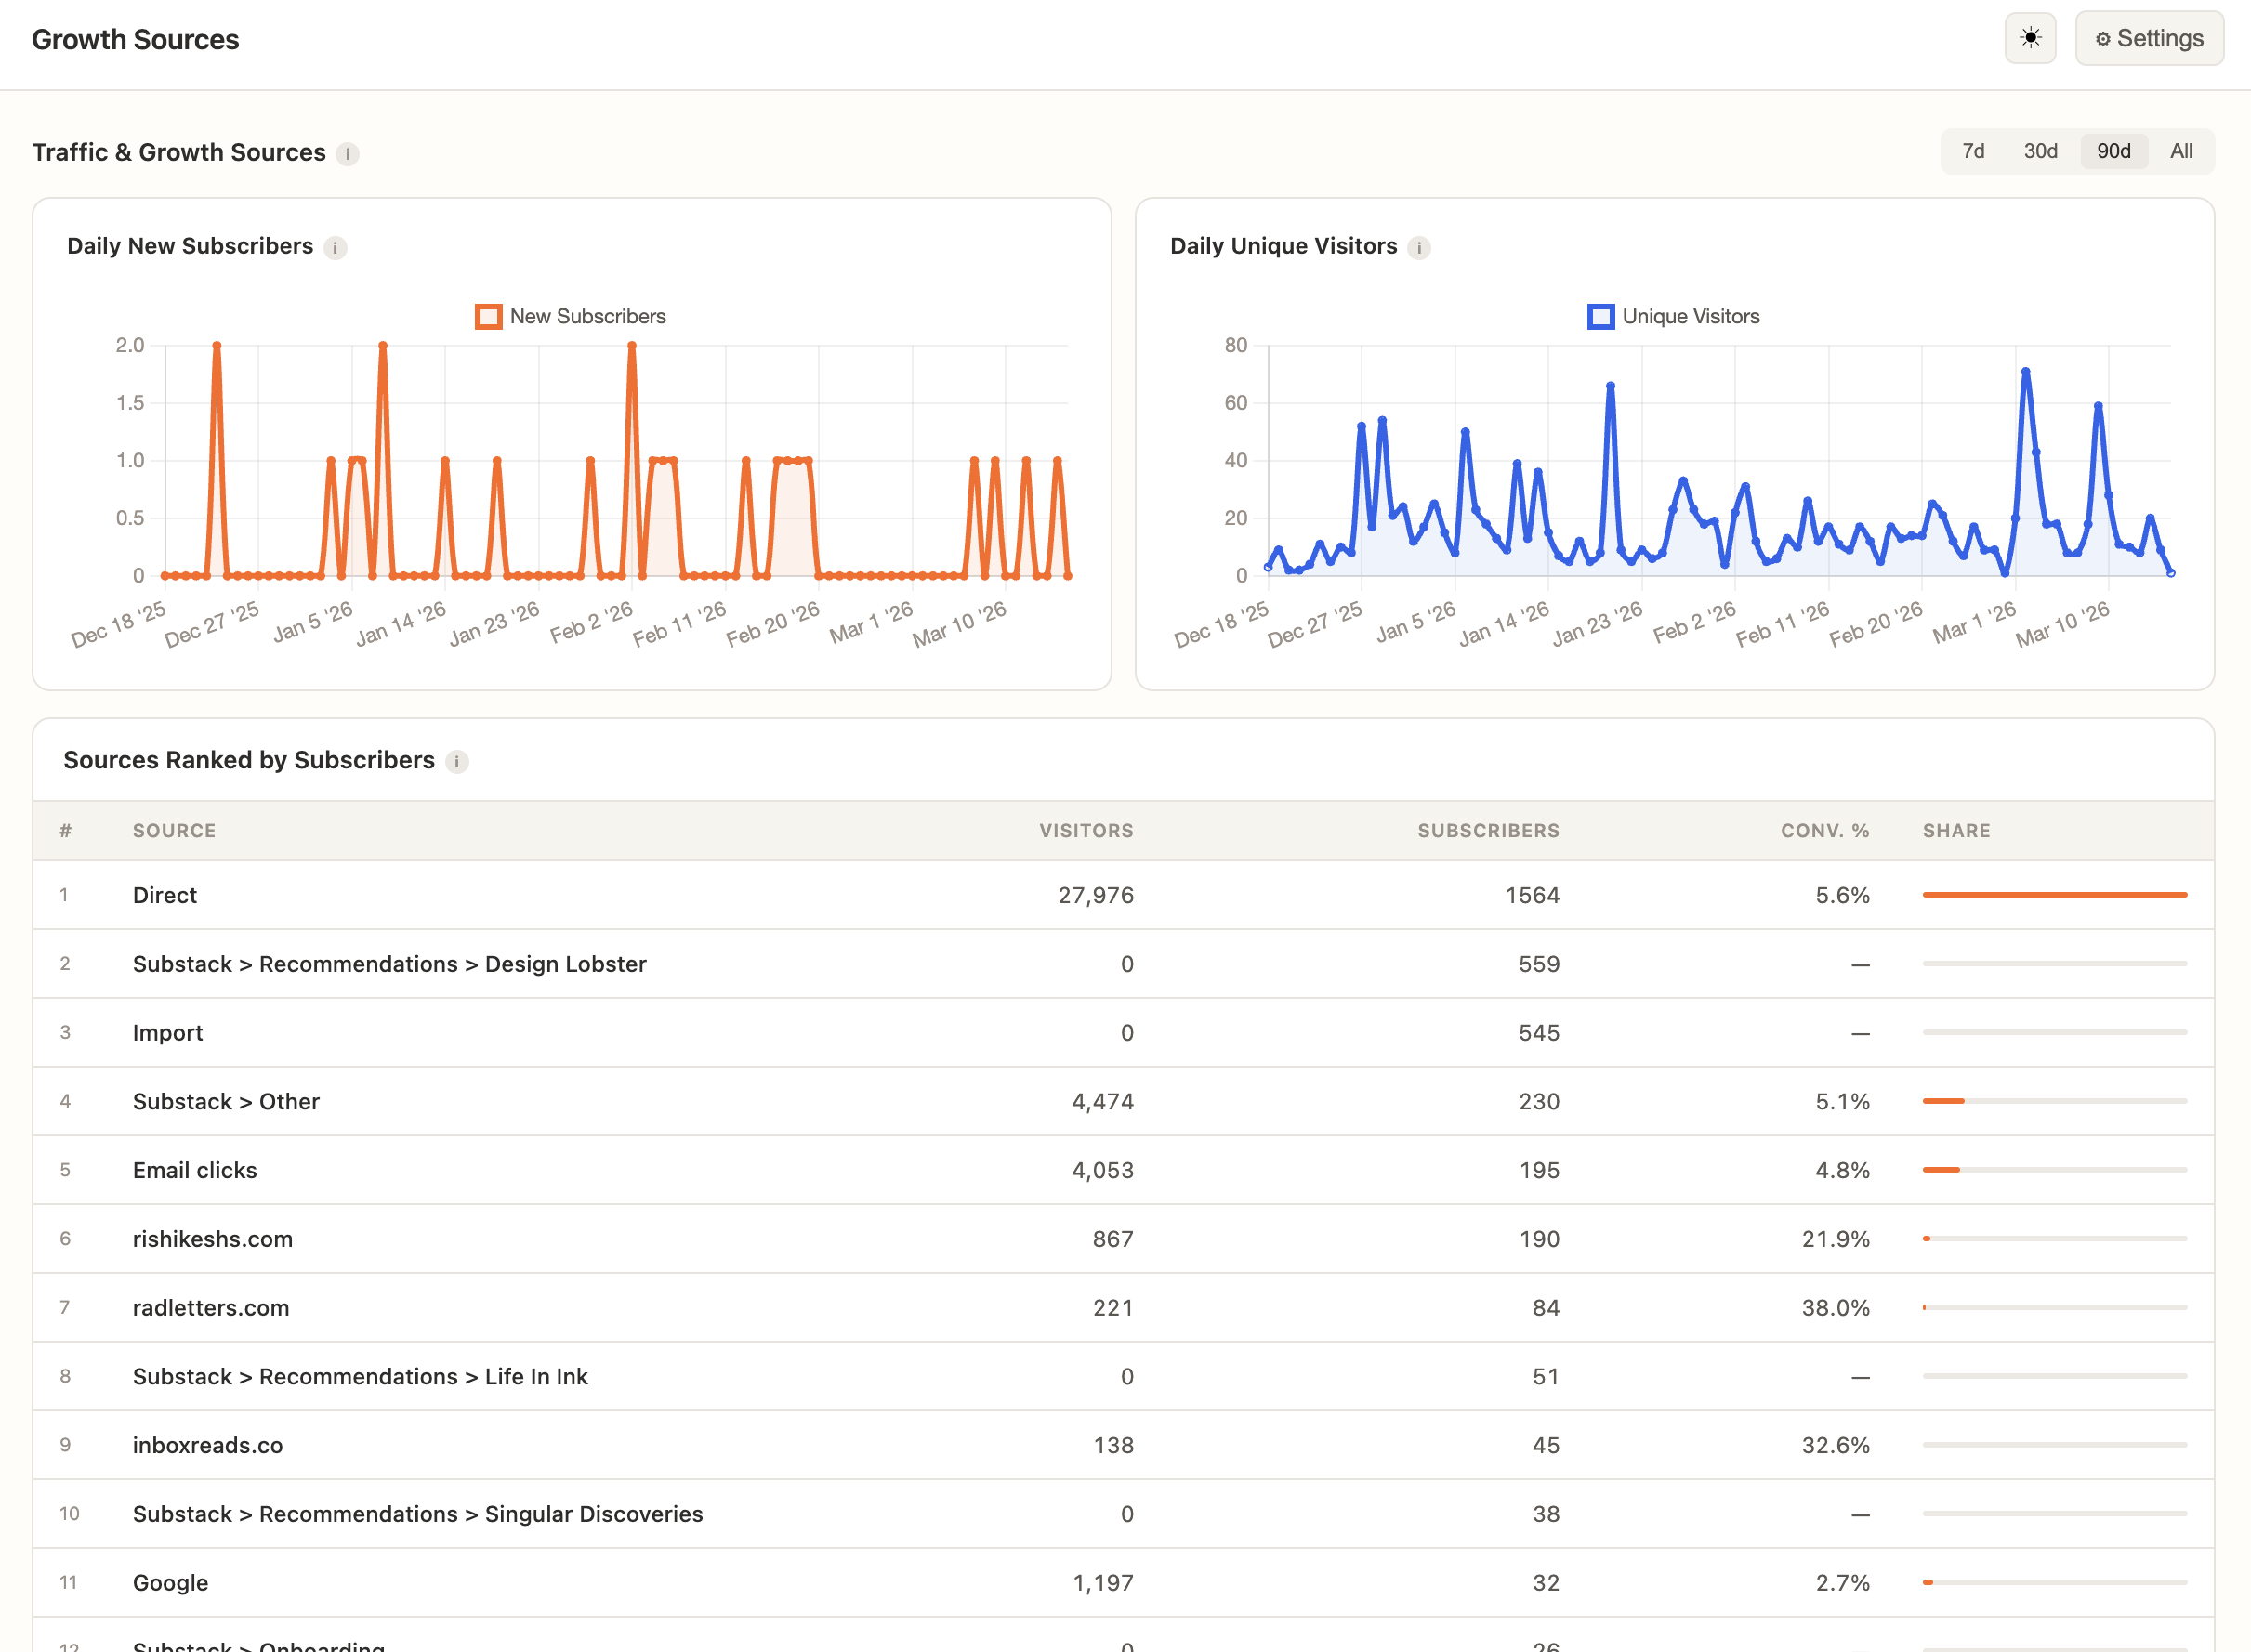
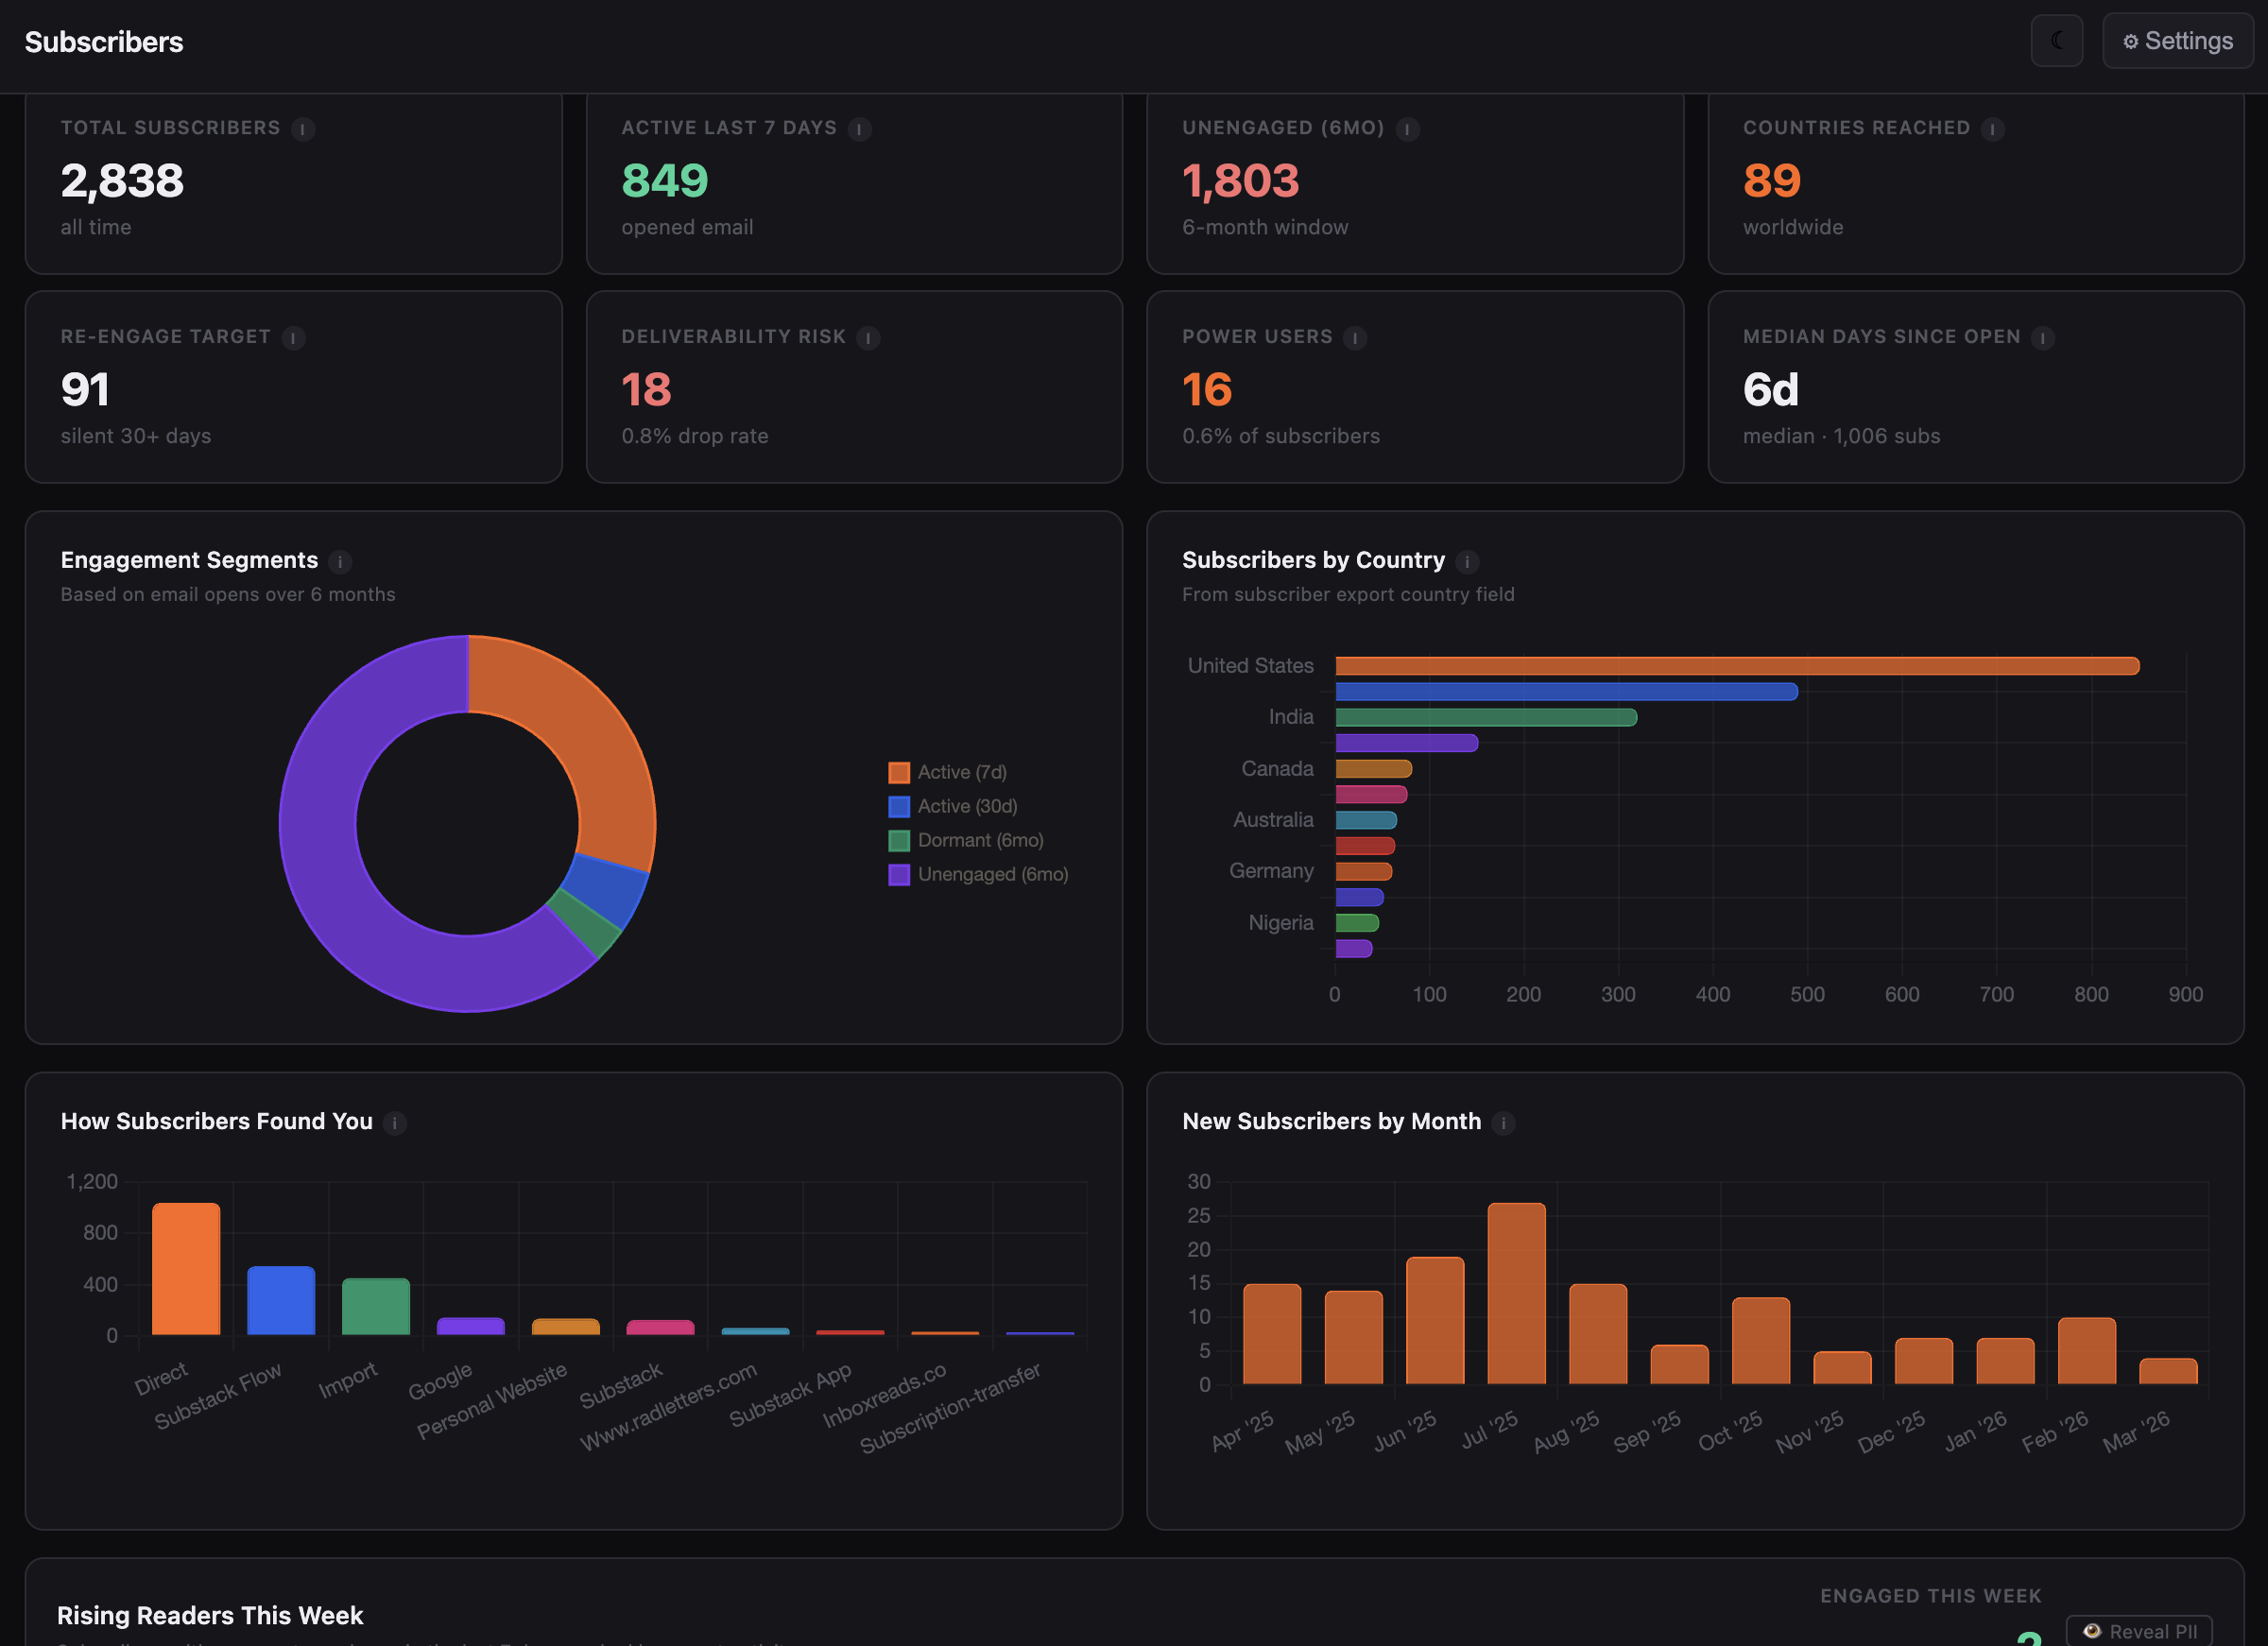
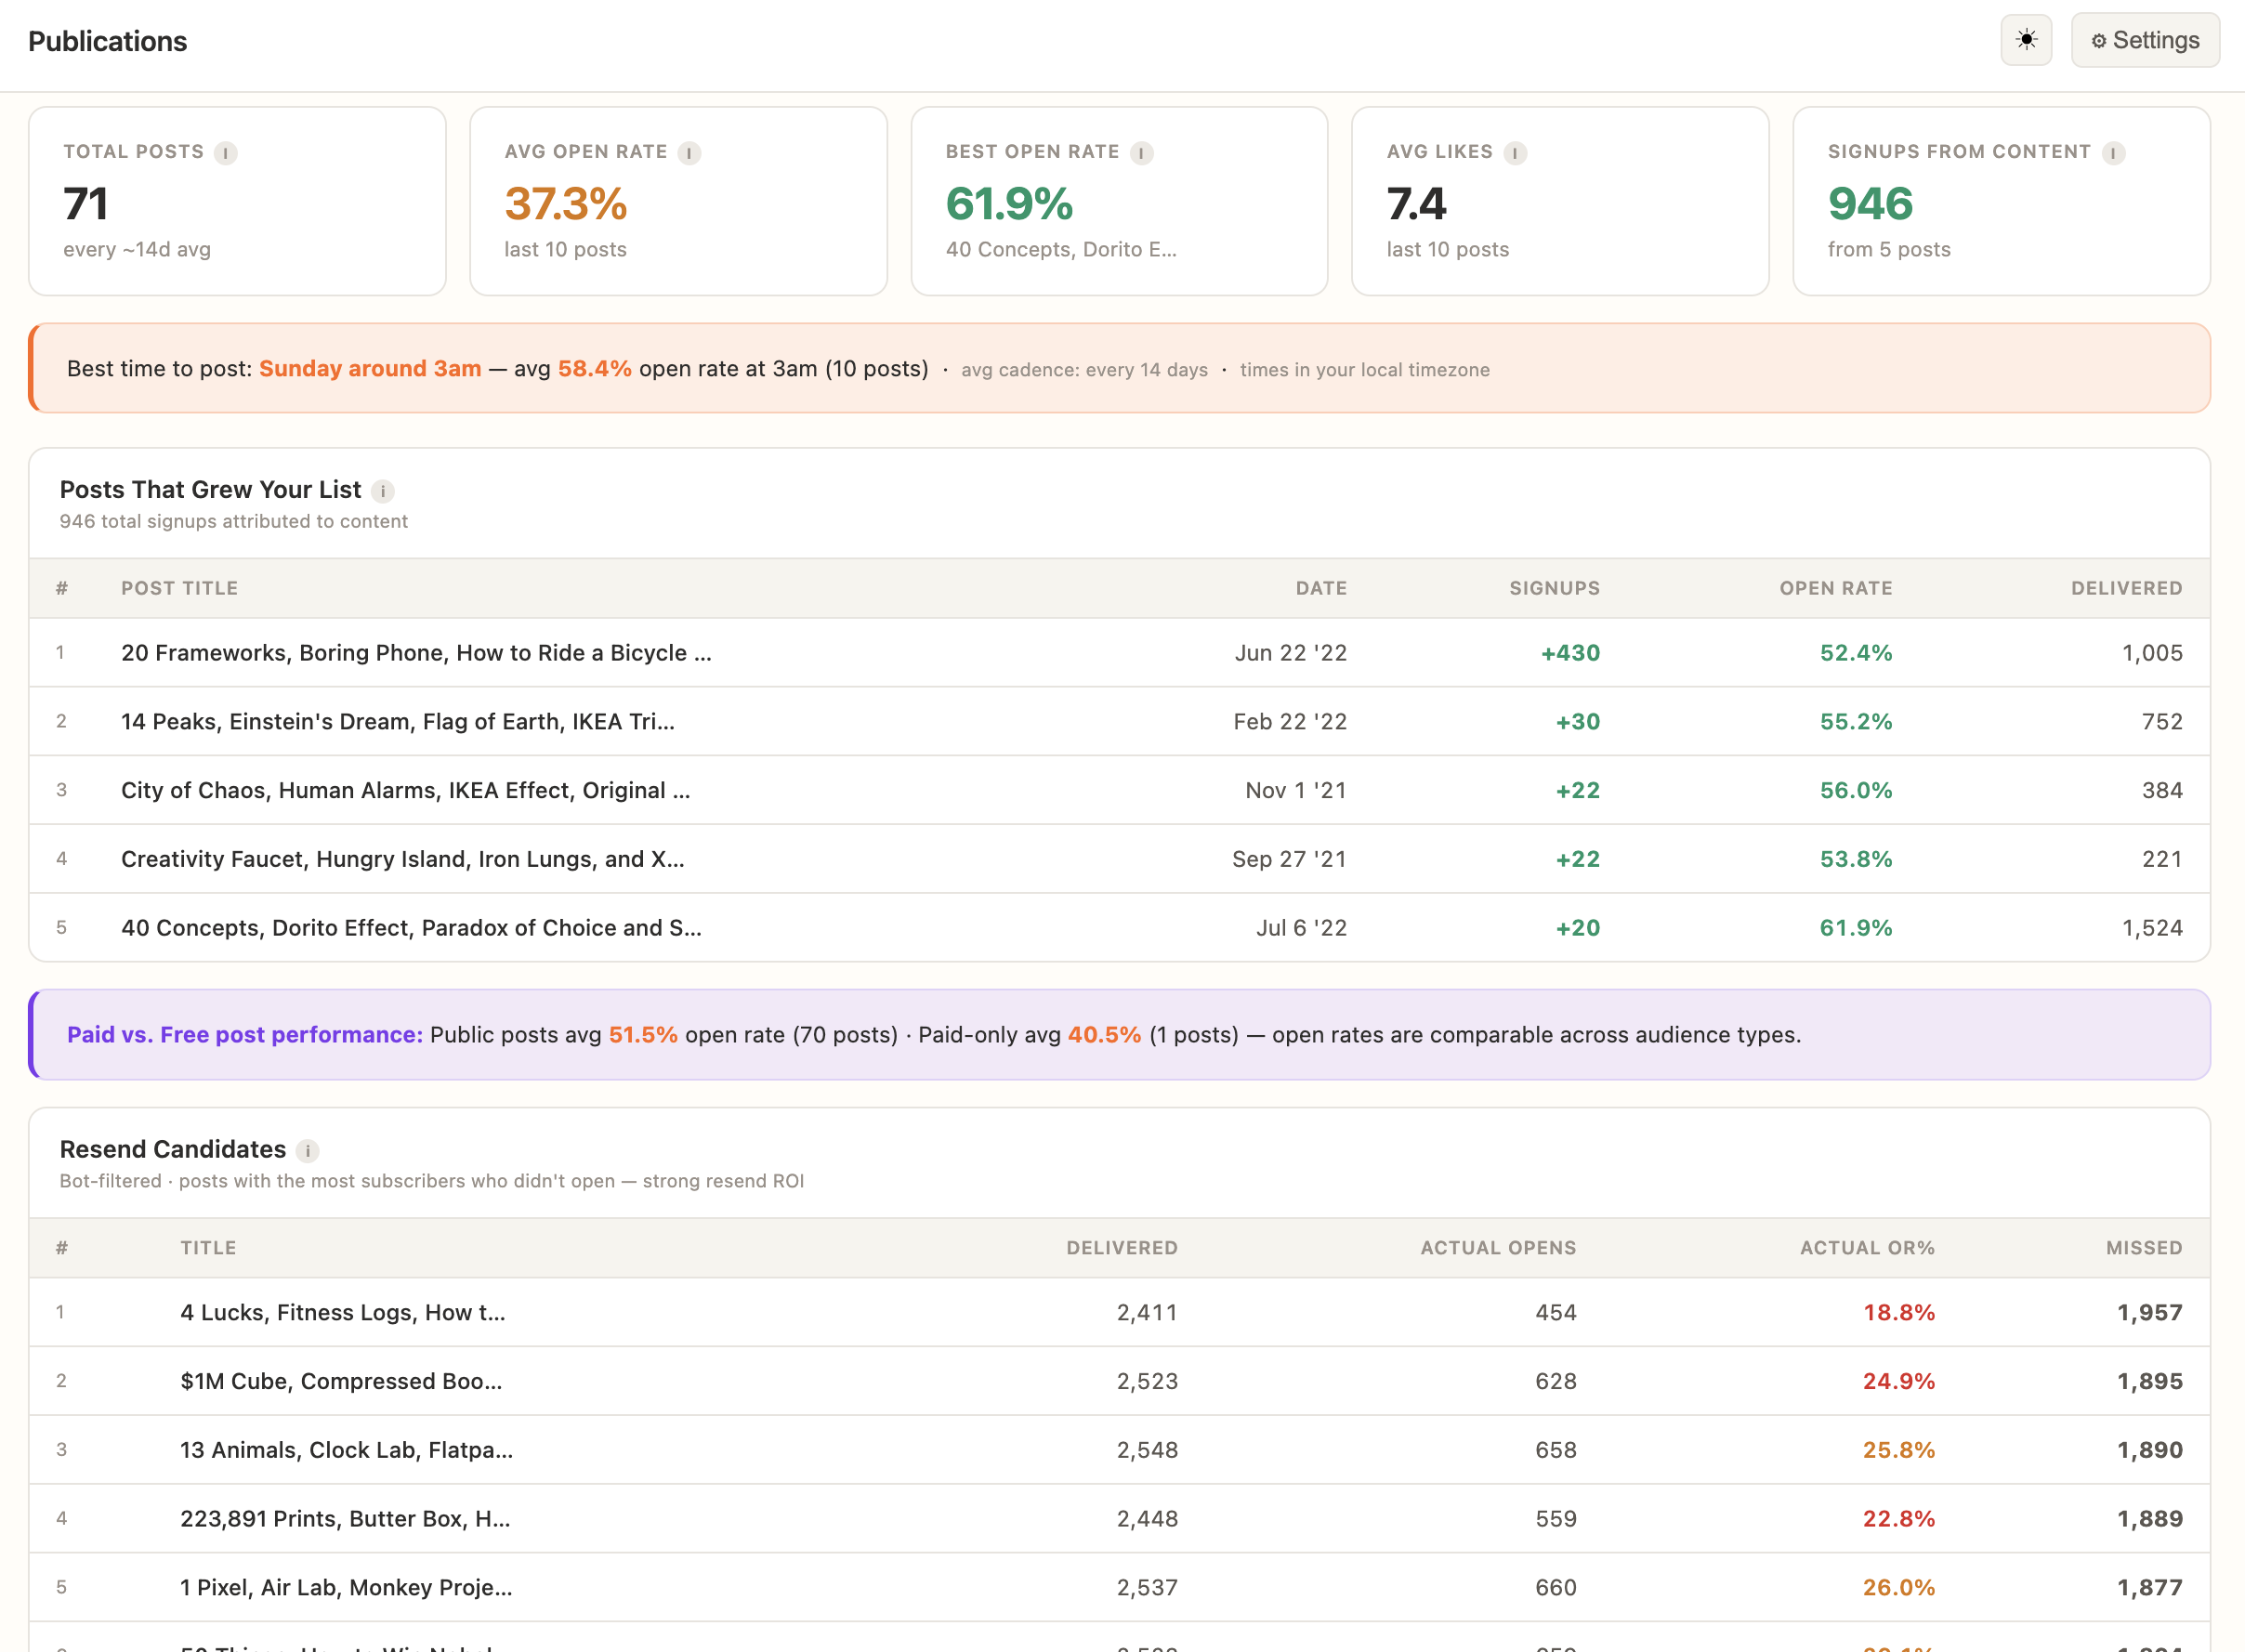
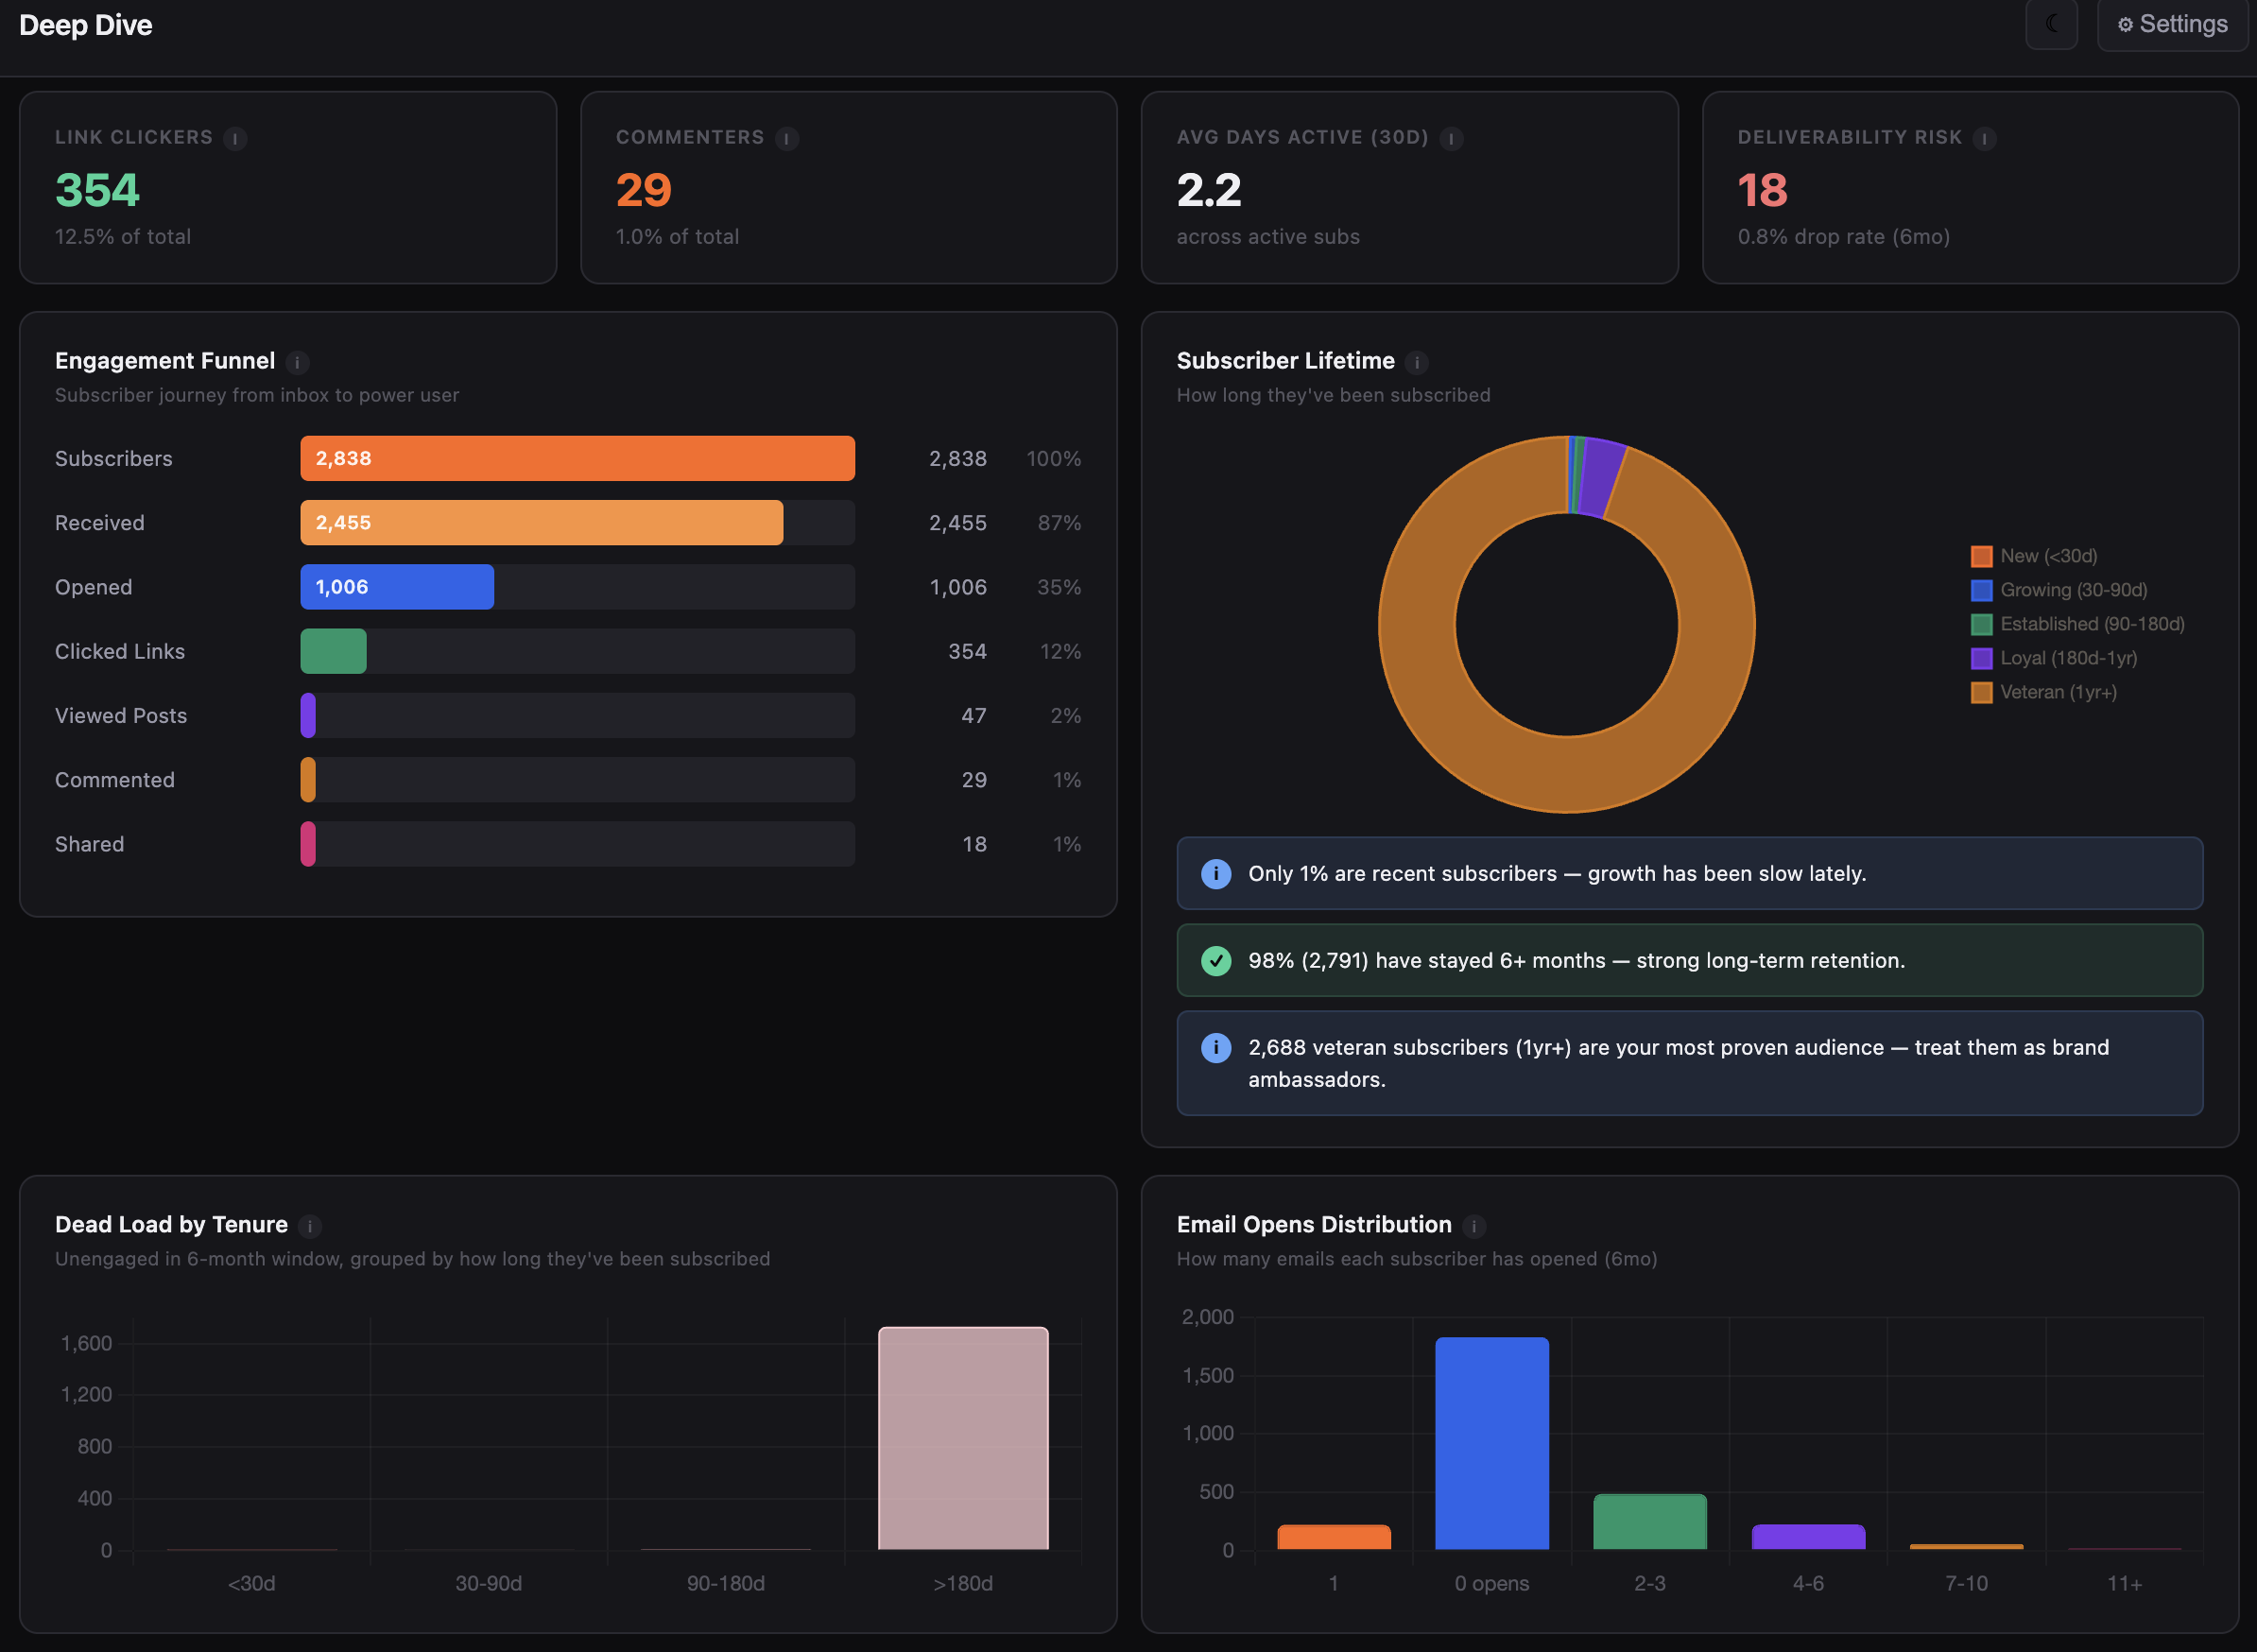
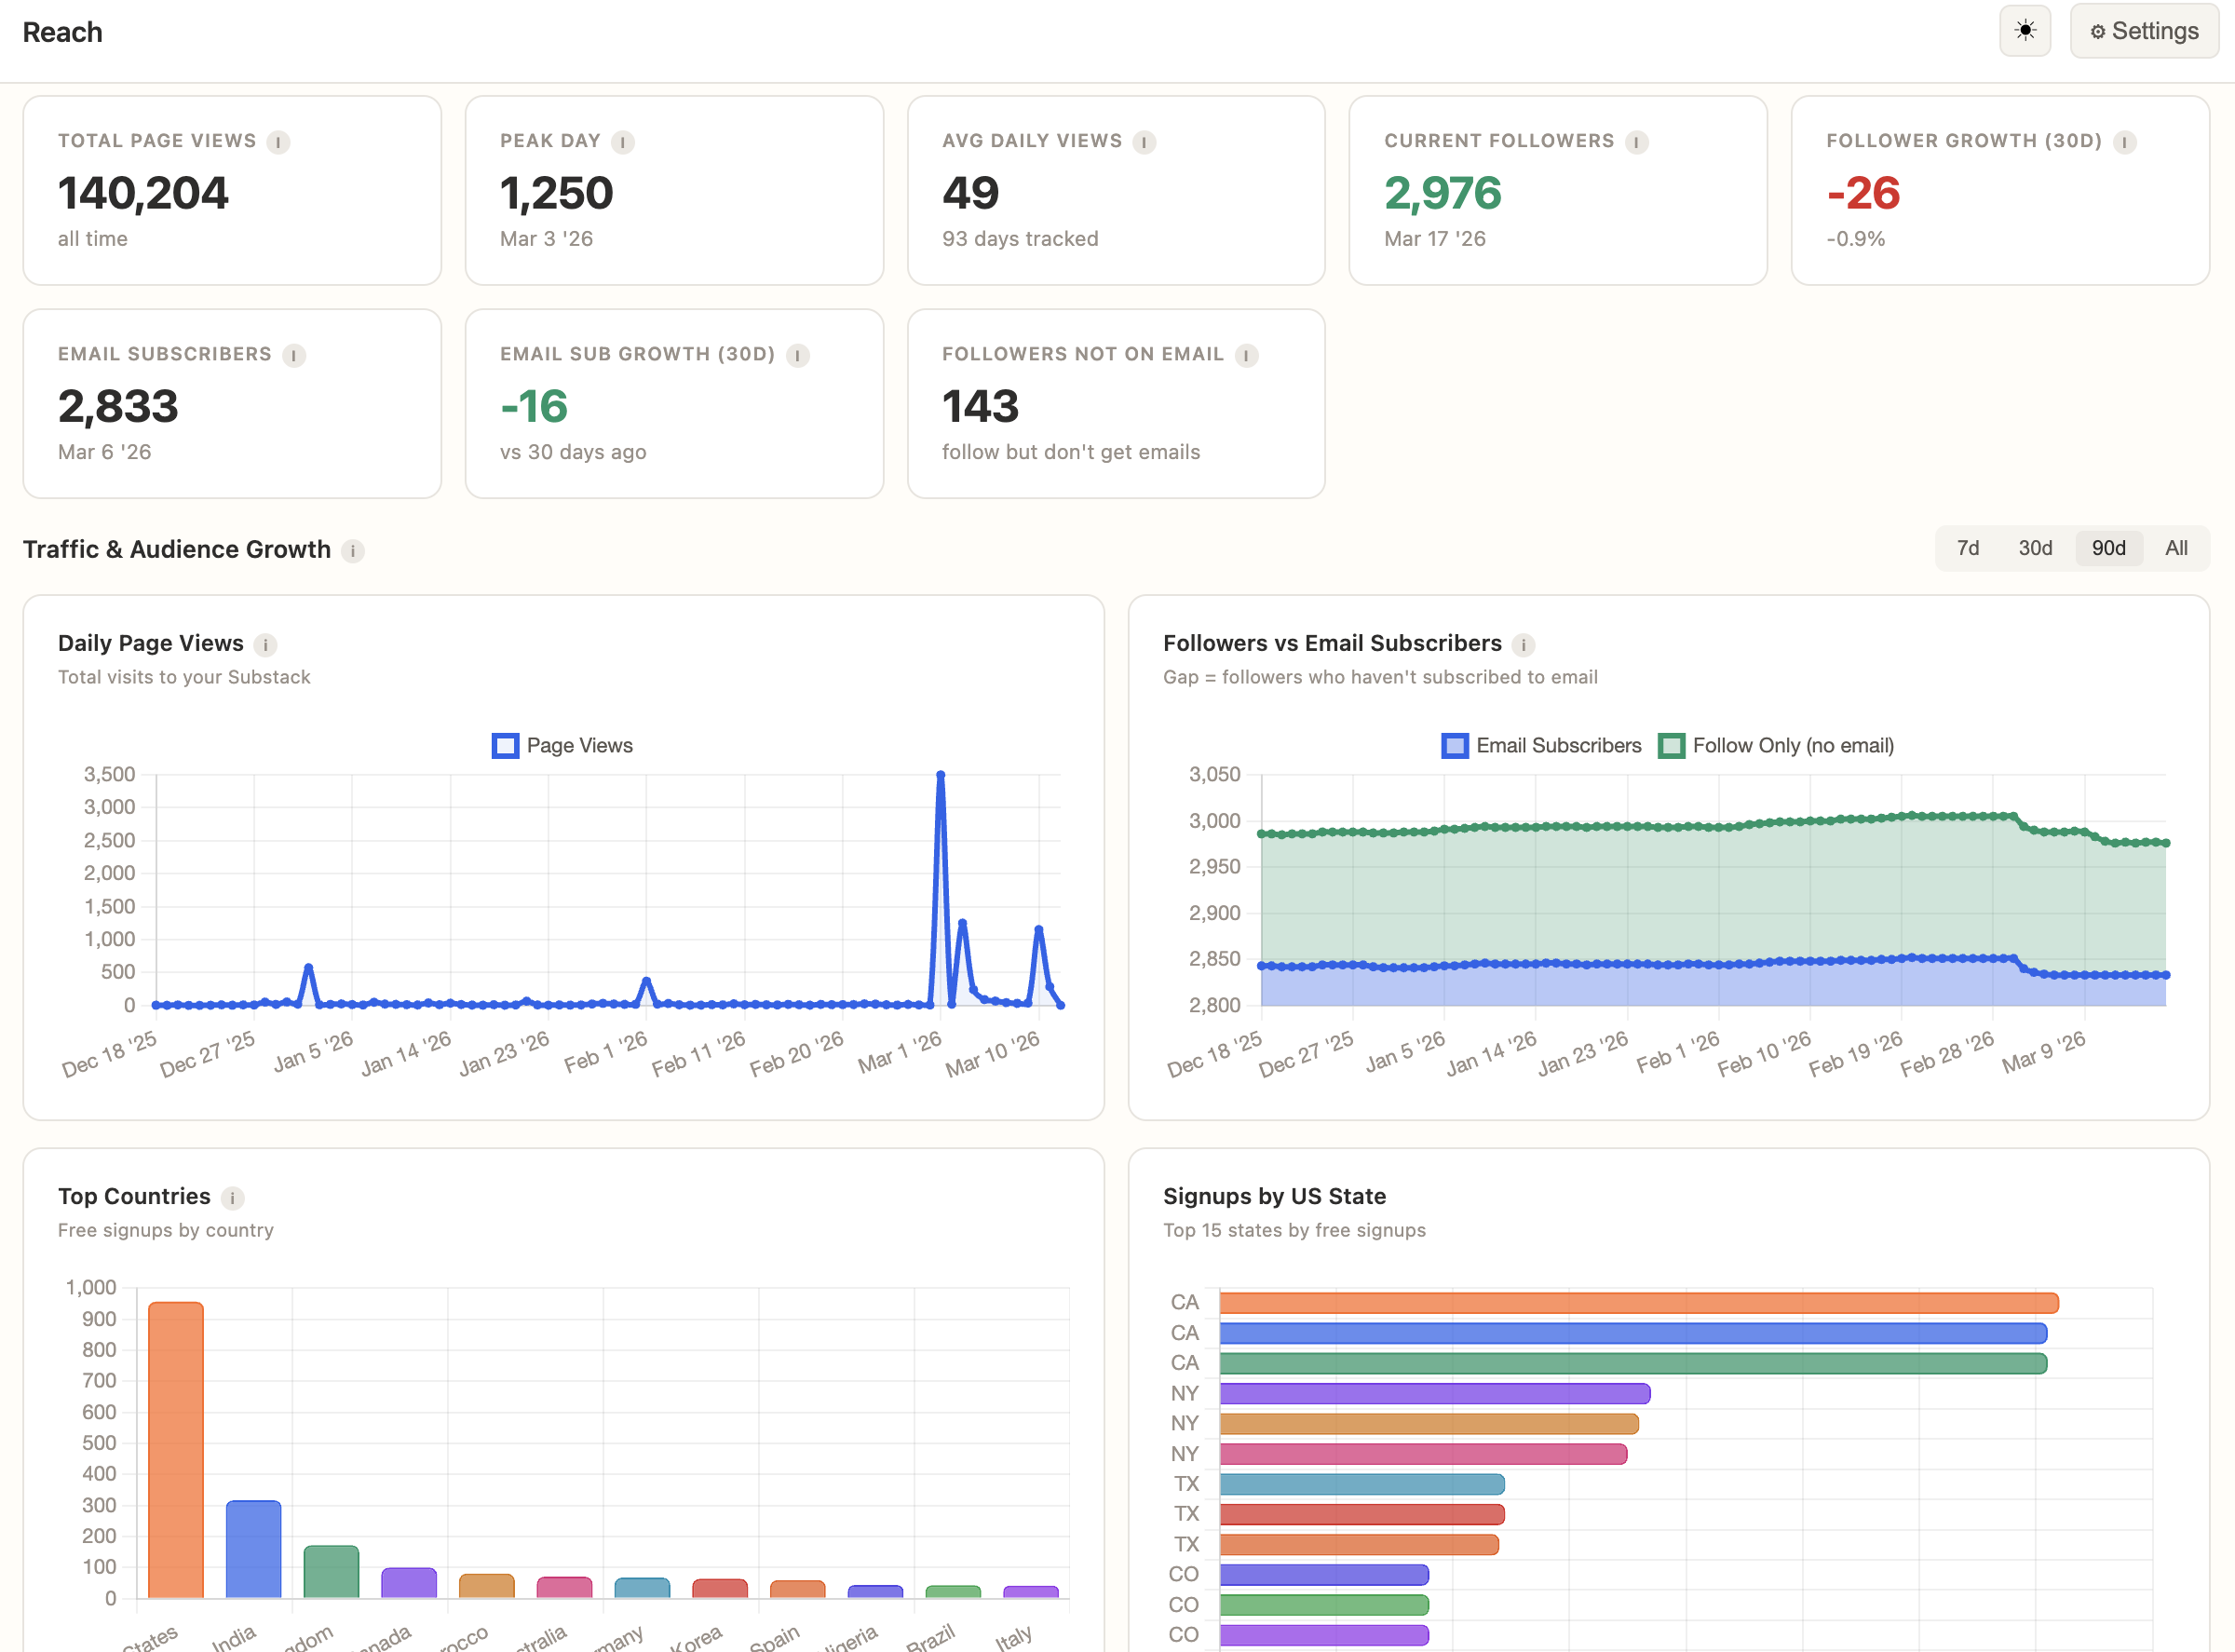
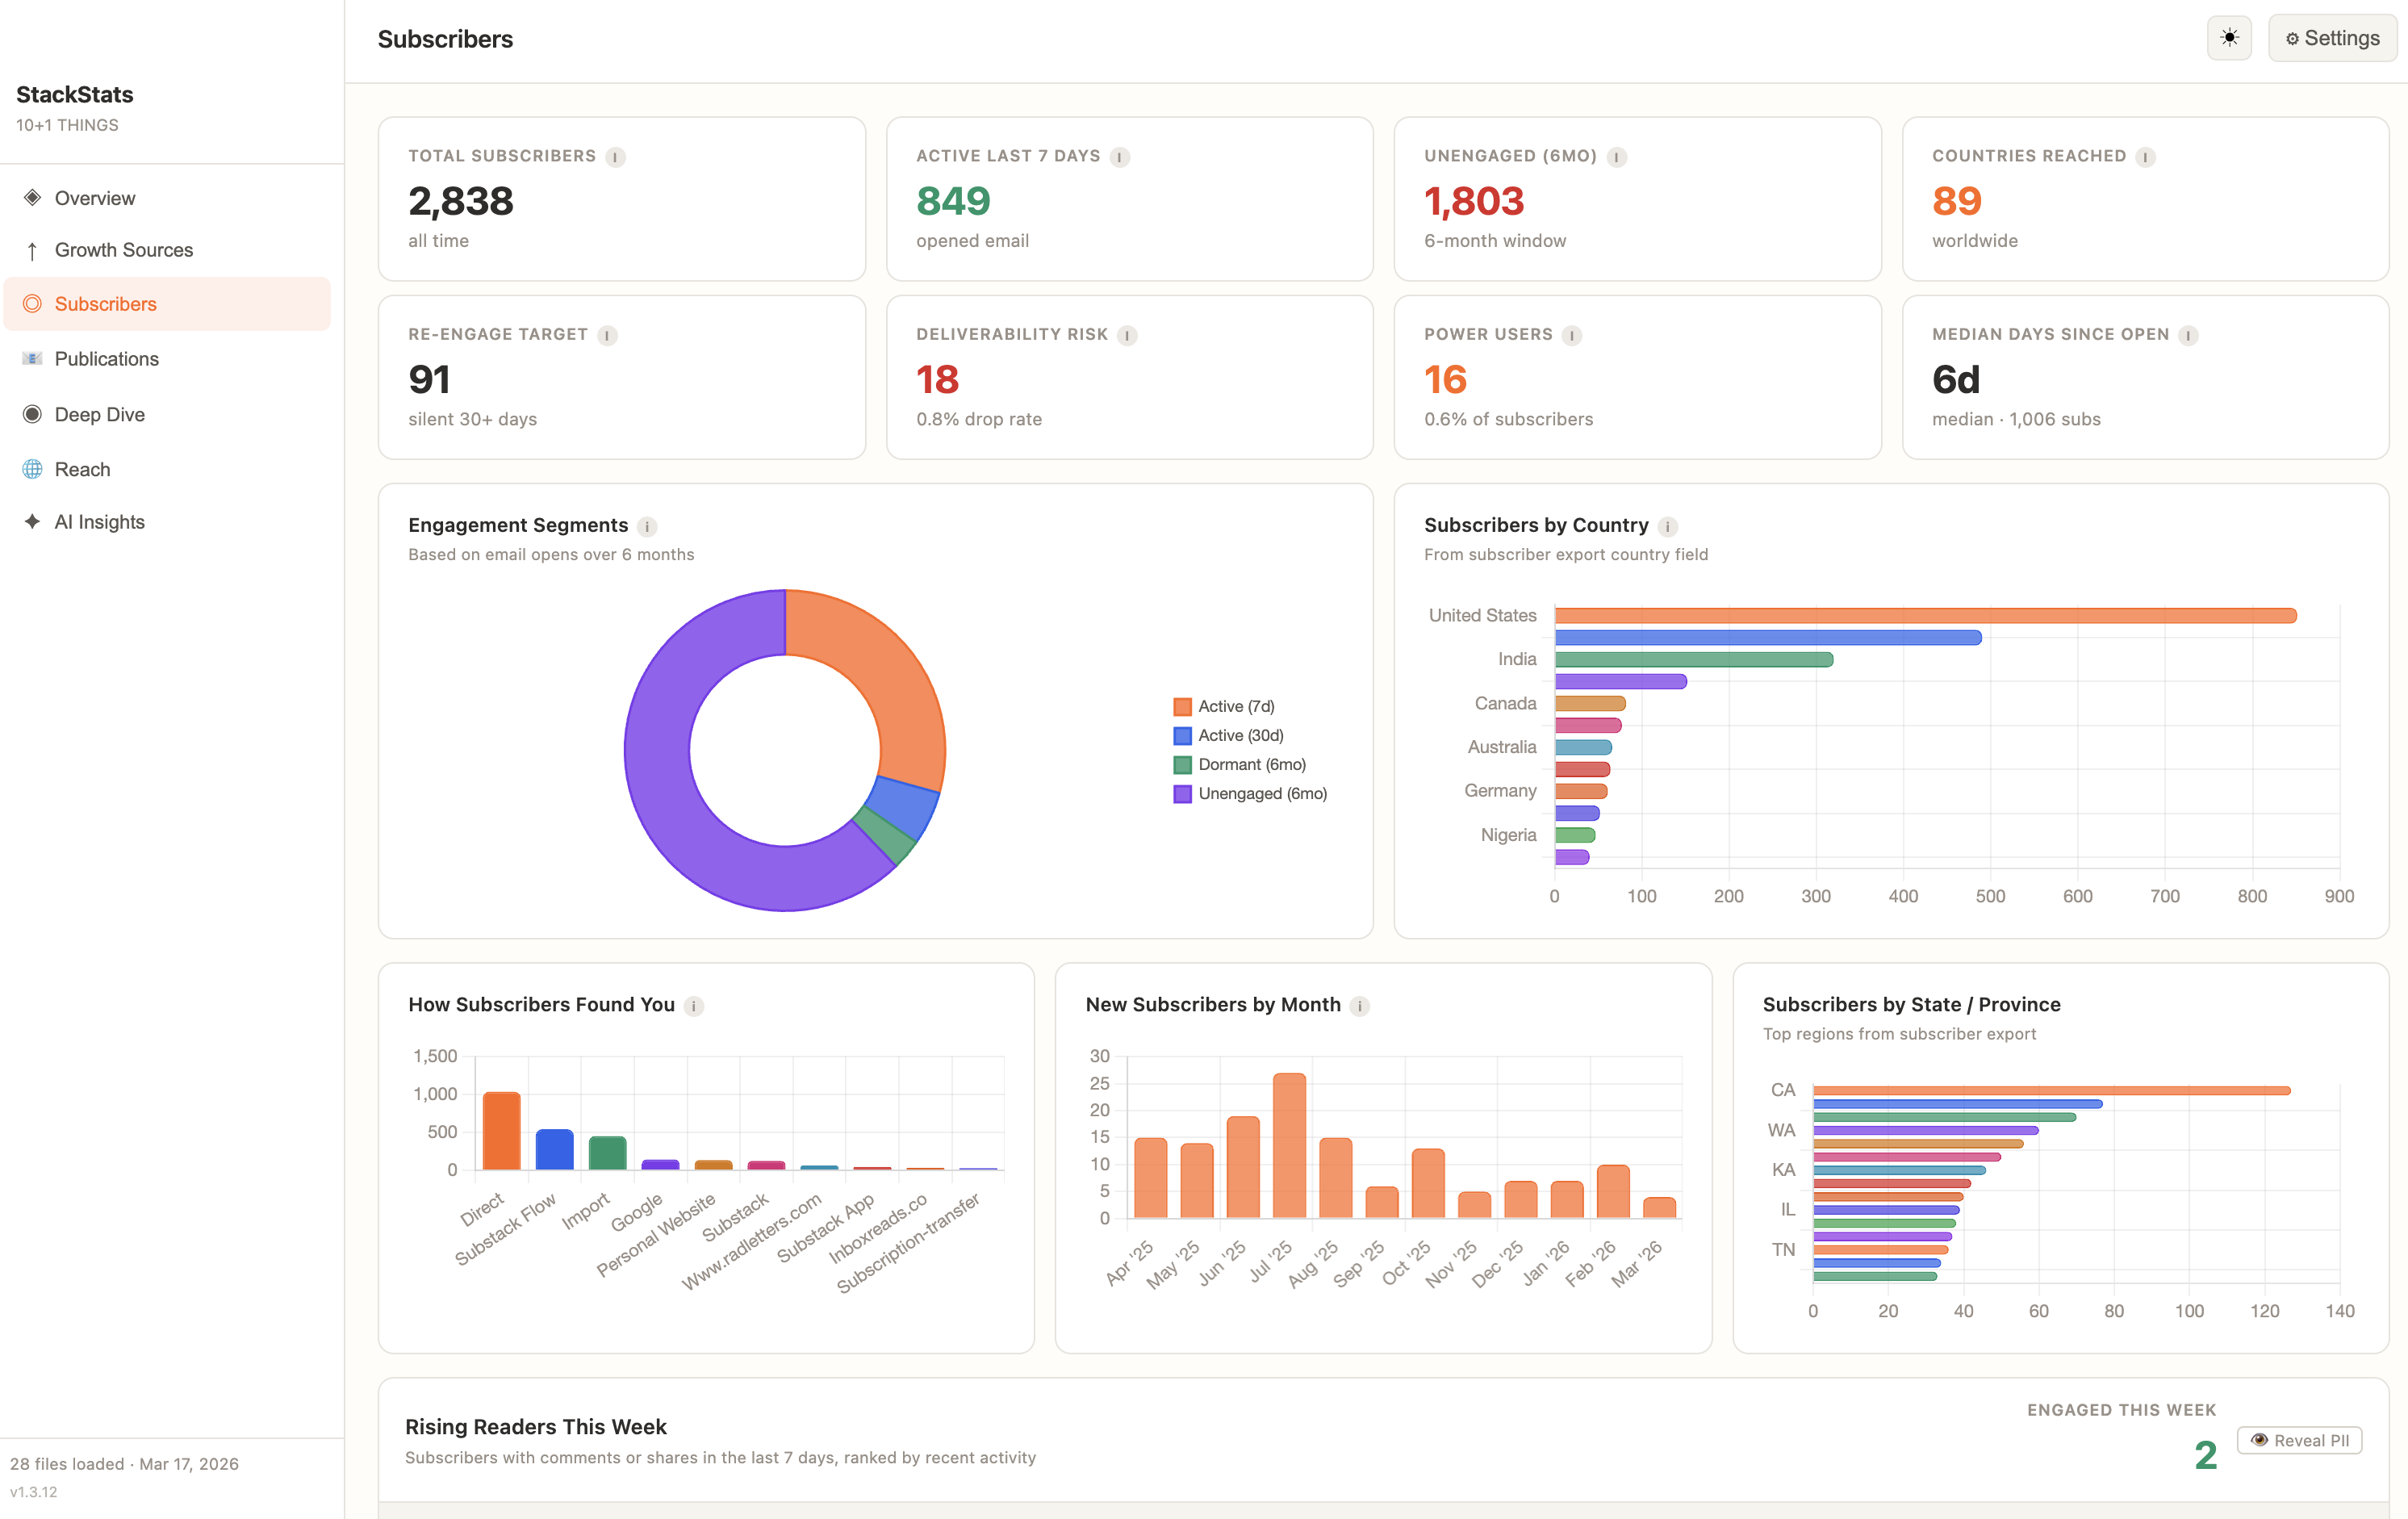
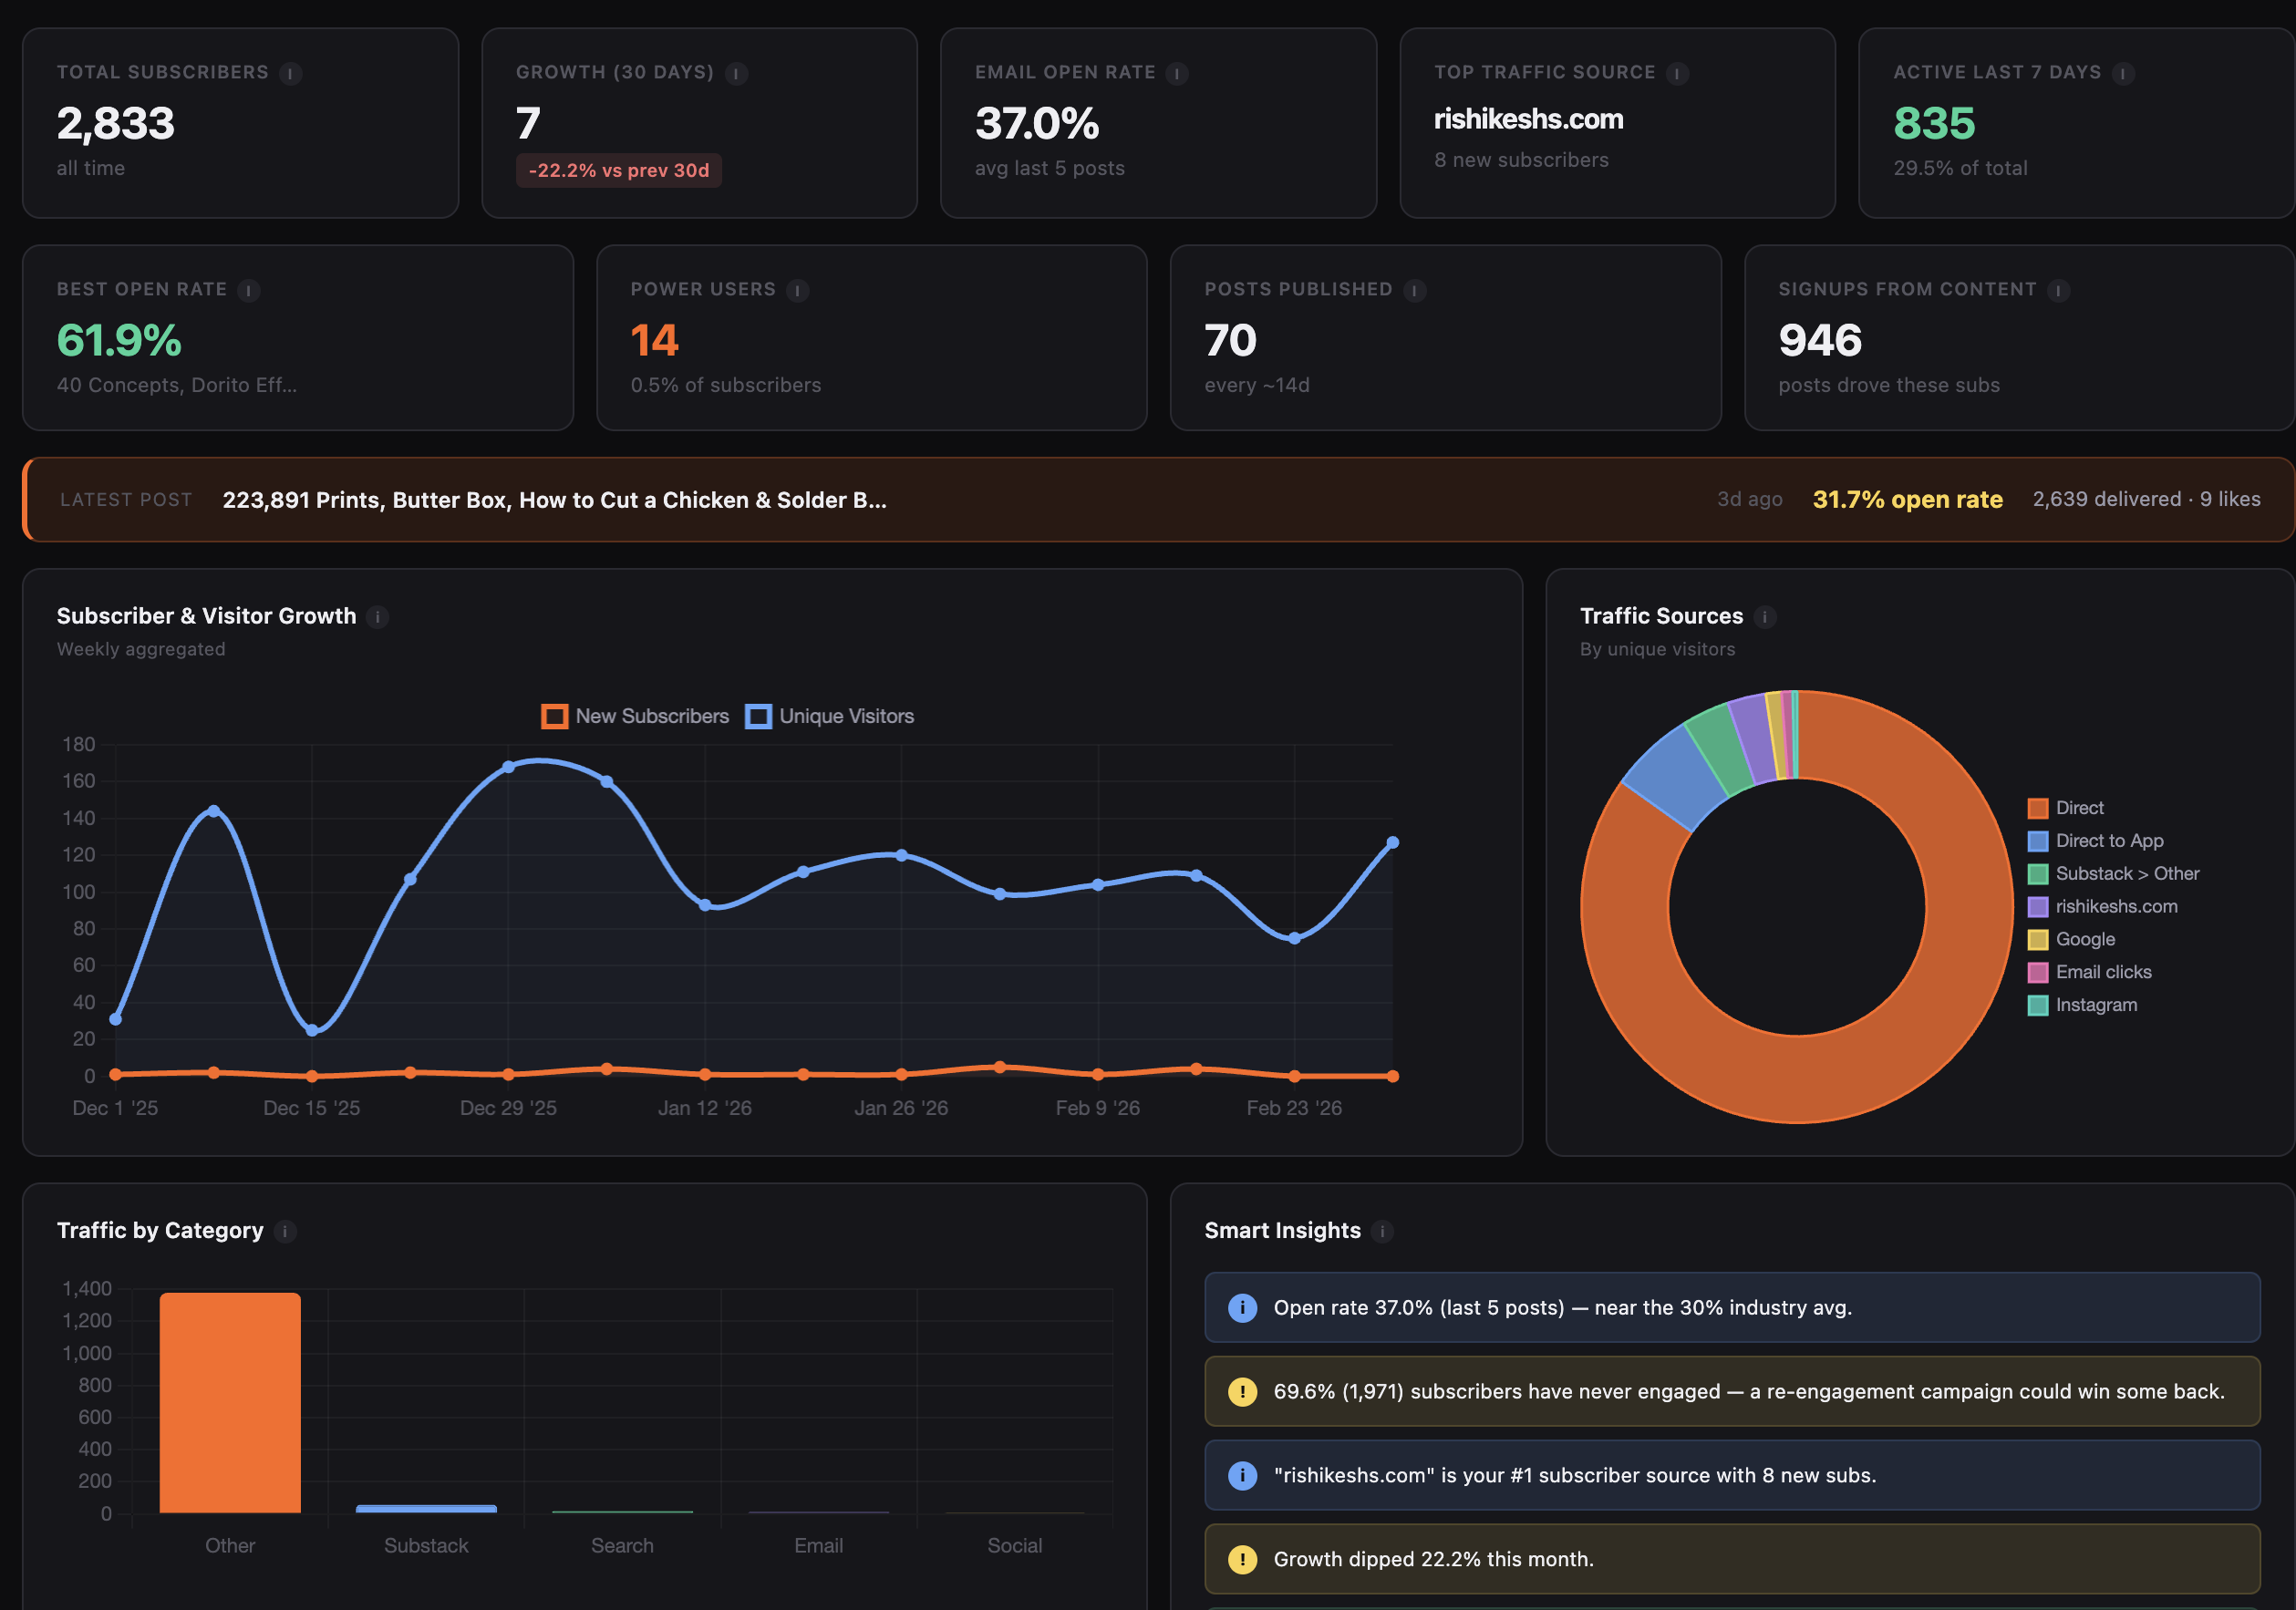
Export your data, drop in the CSVs. Real open rates, ghost subscribers, growth sources that actually convert.
Desktop app for Mac & Windows · No account · No internet required
Click the card behind to switch