100% local
No cloud
No subscription
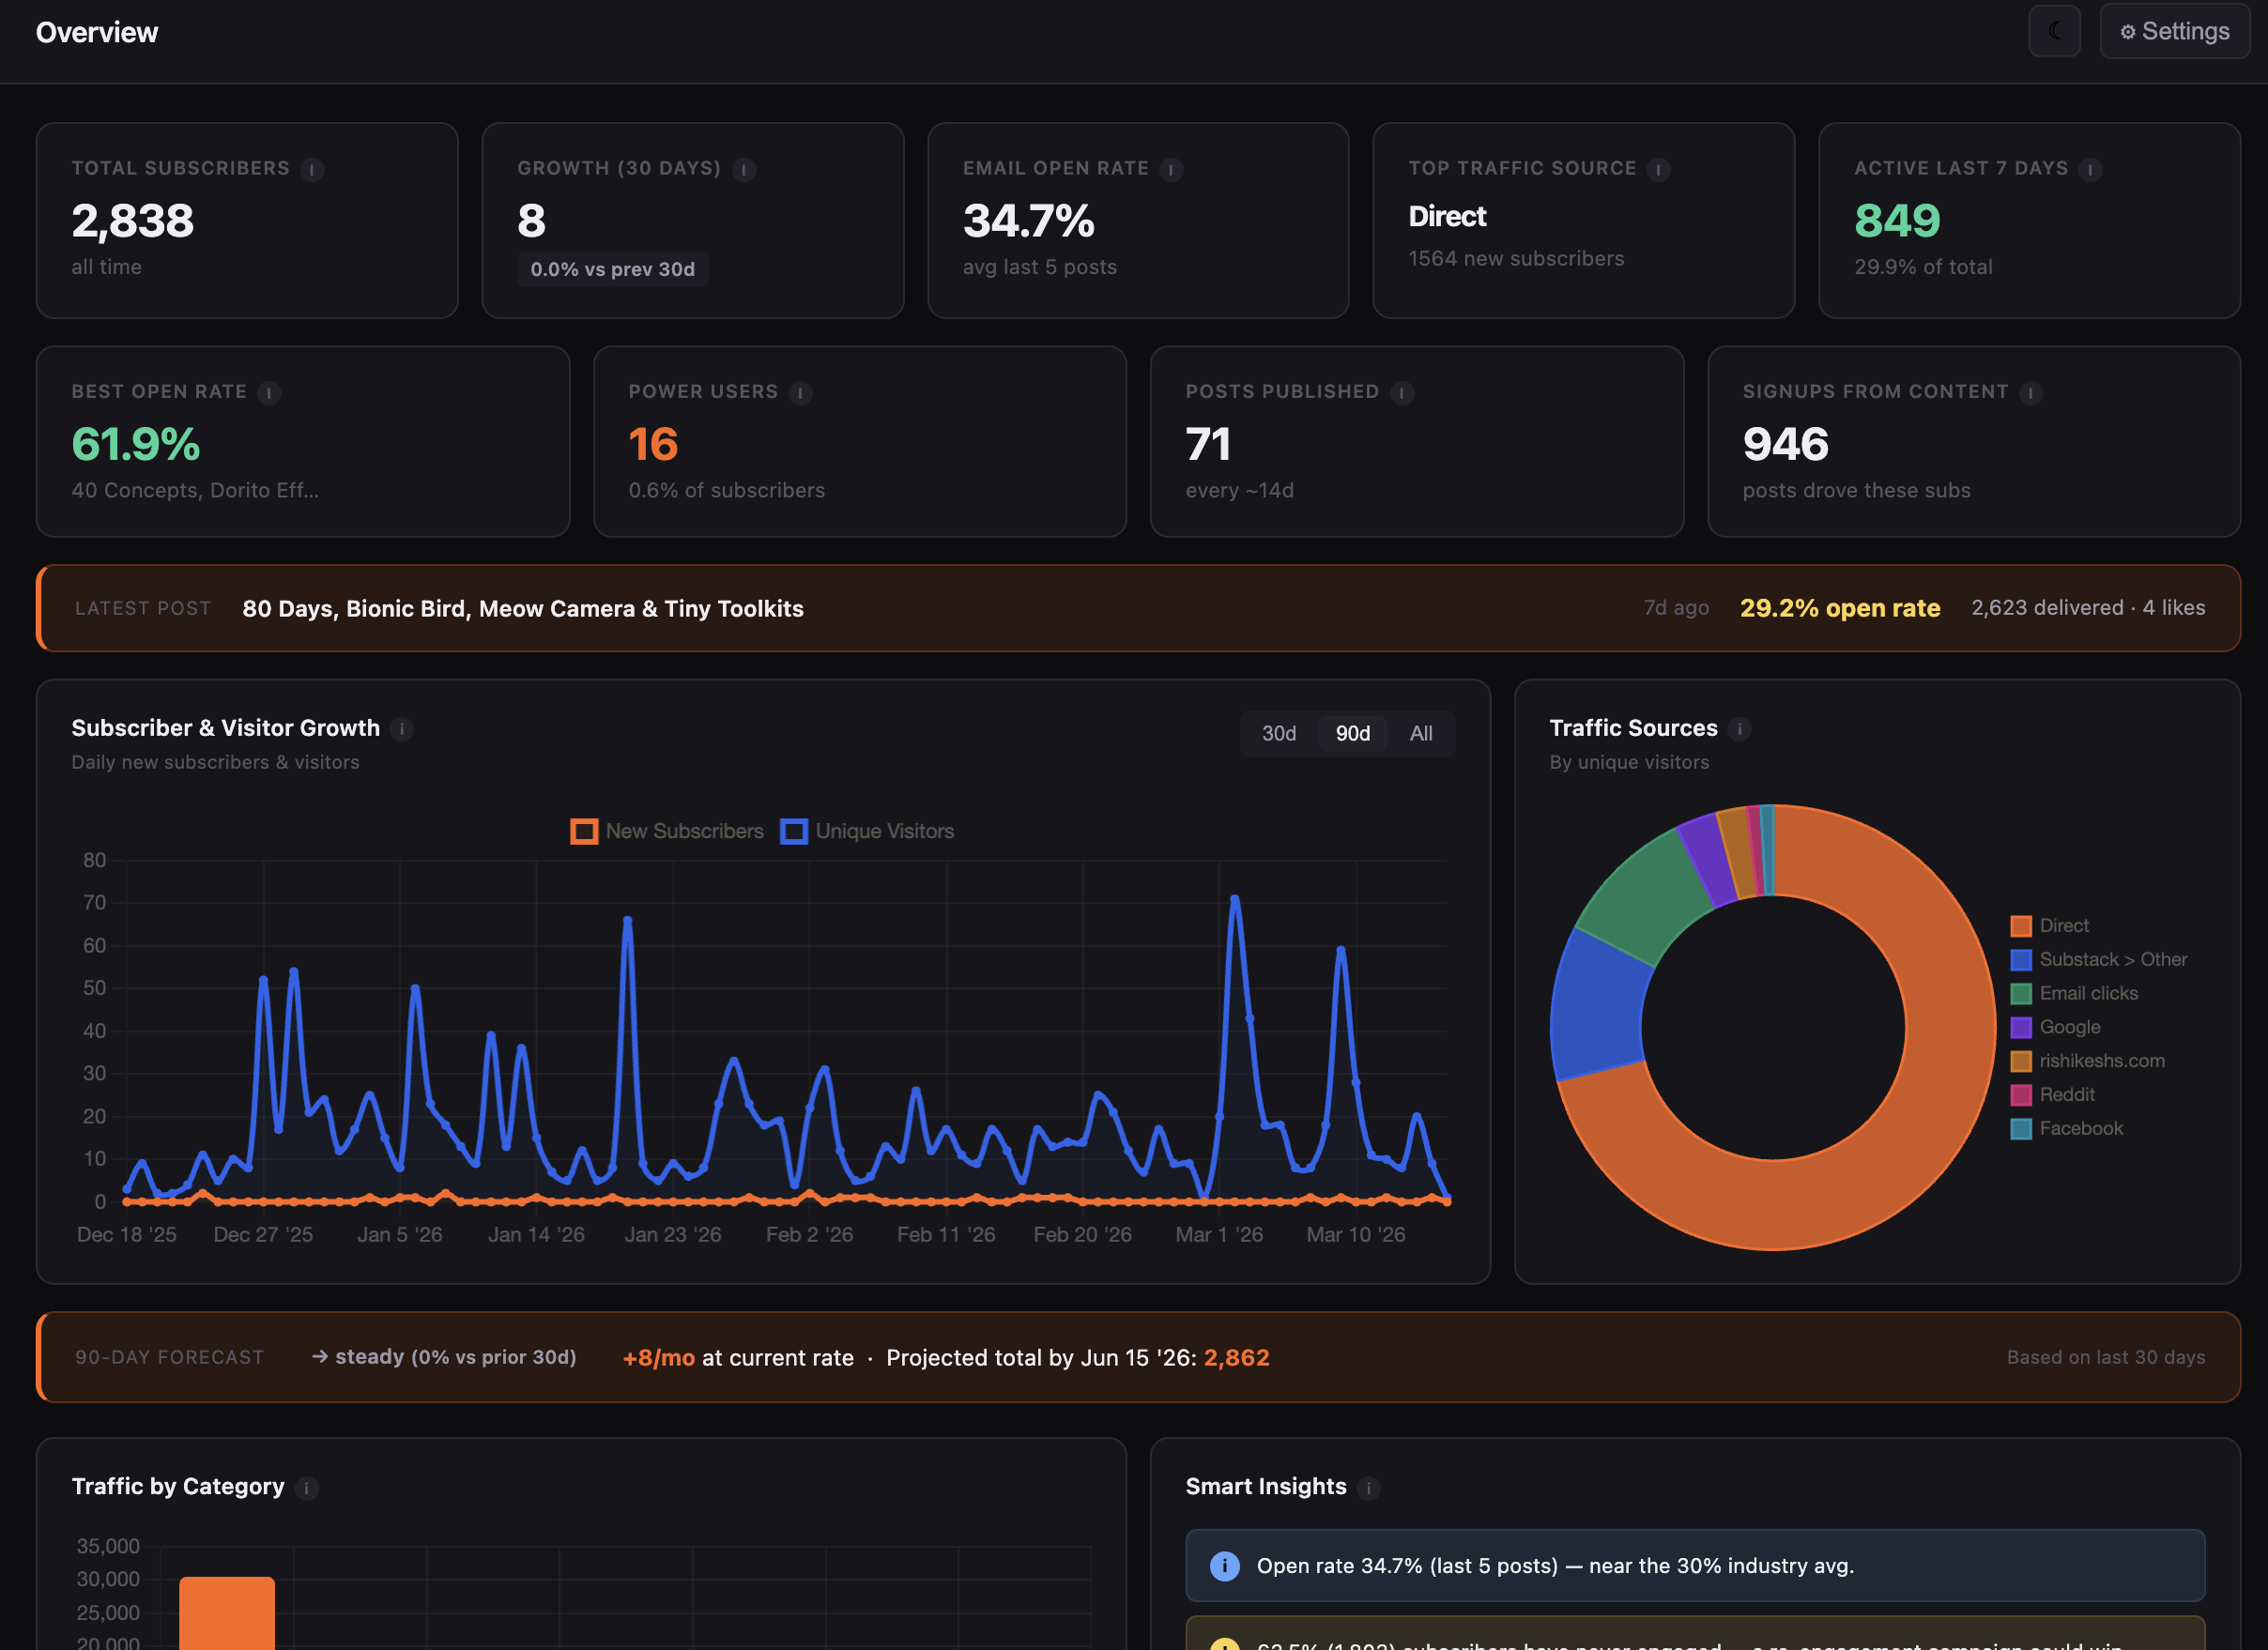
Better analytics
for your Substack™
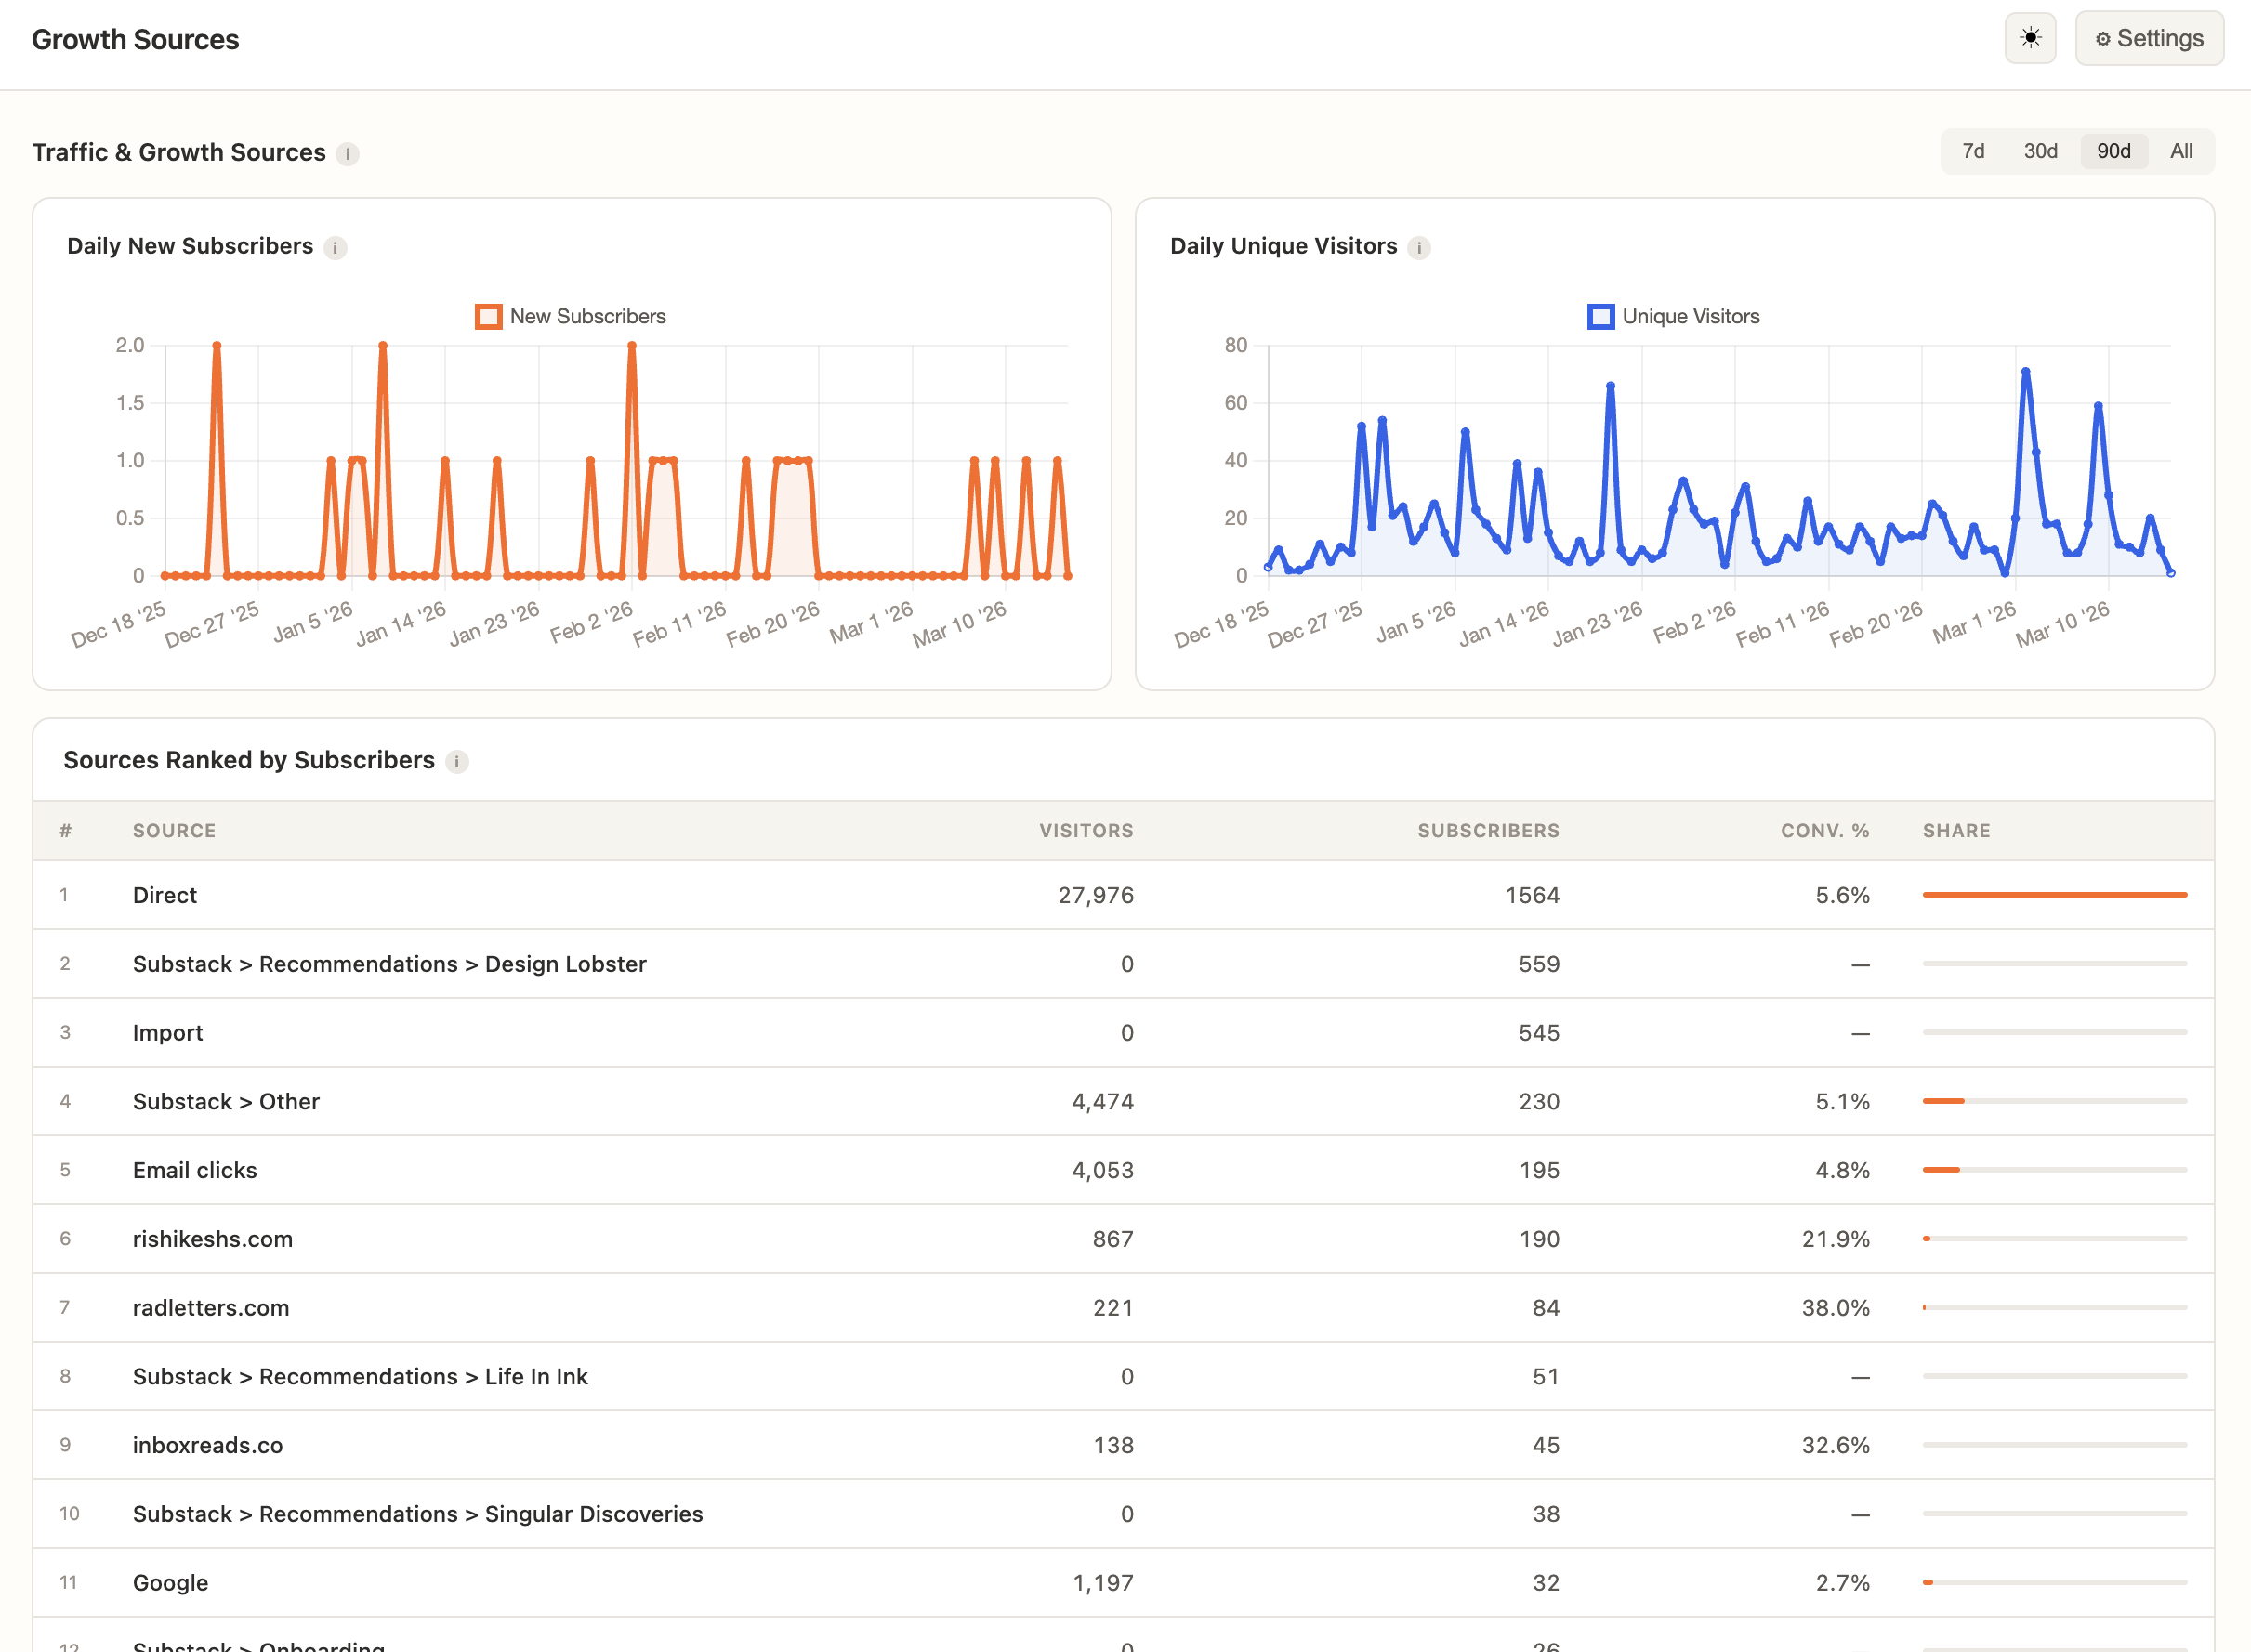
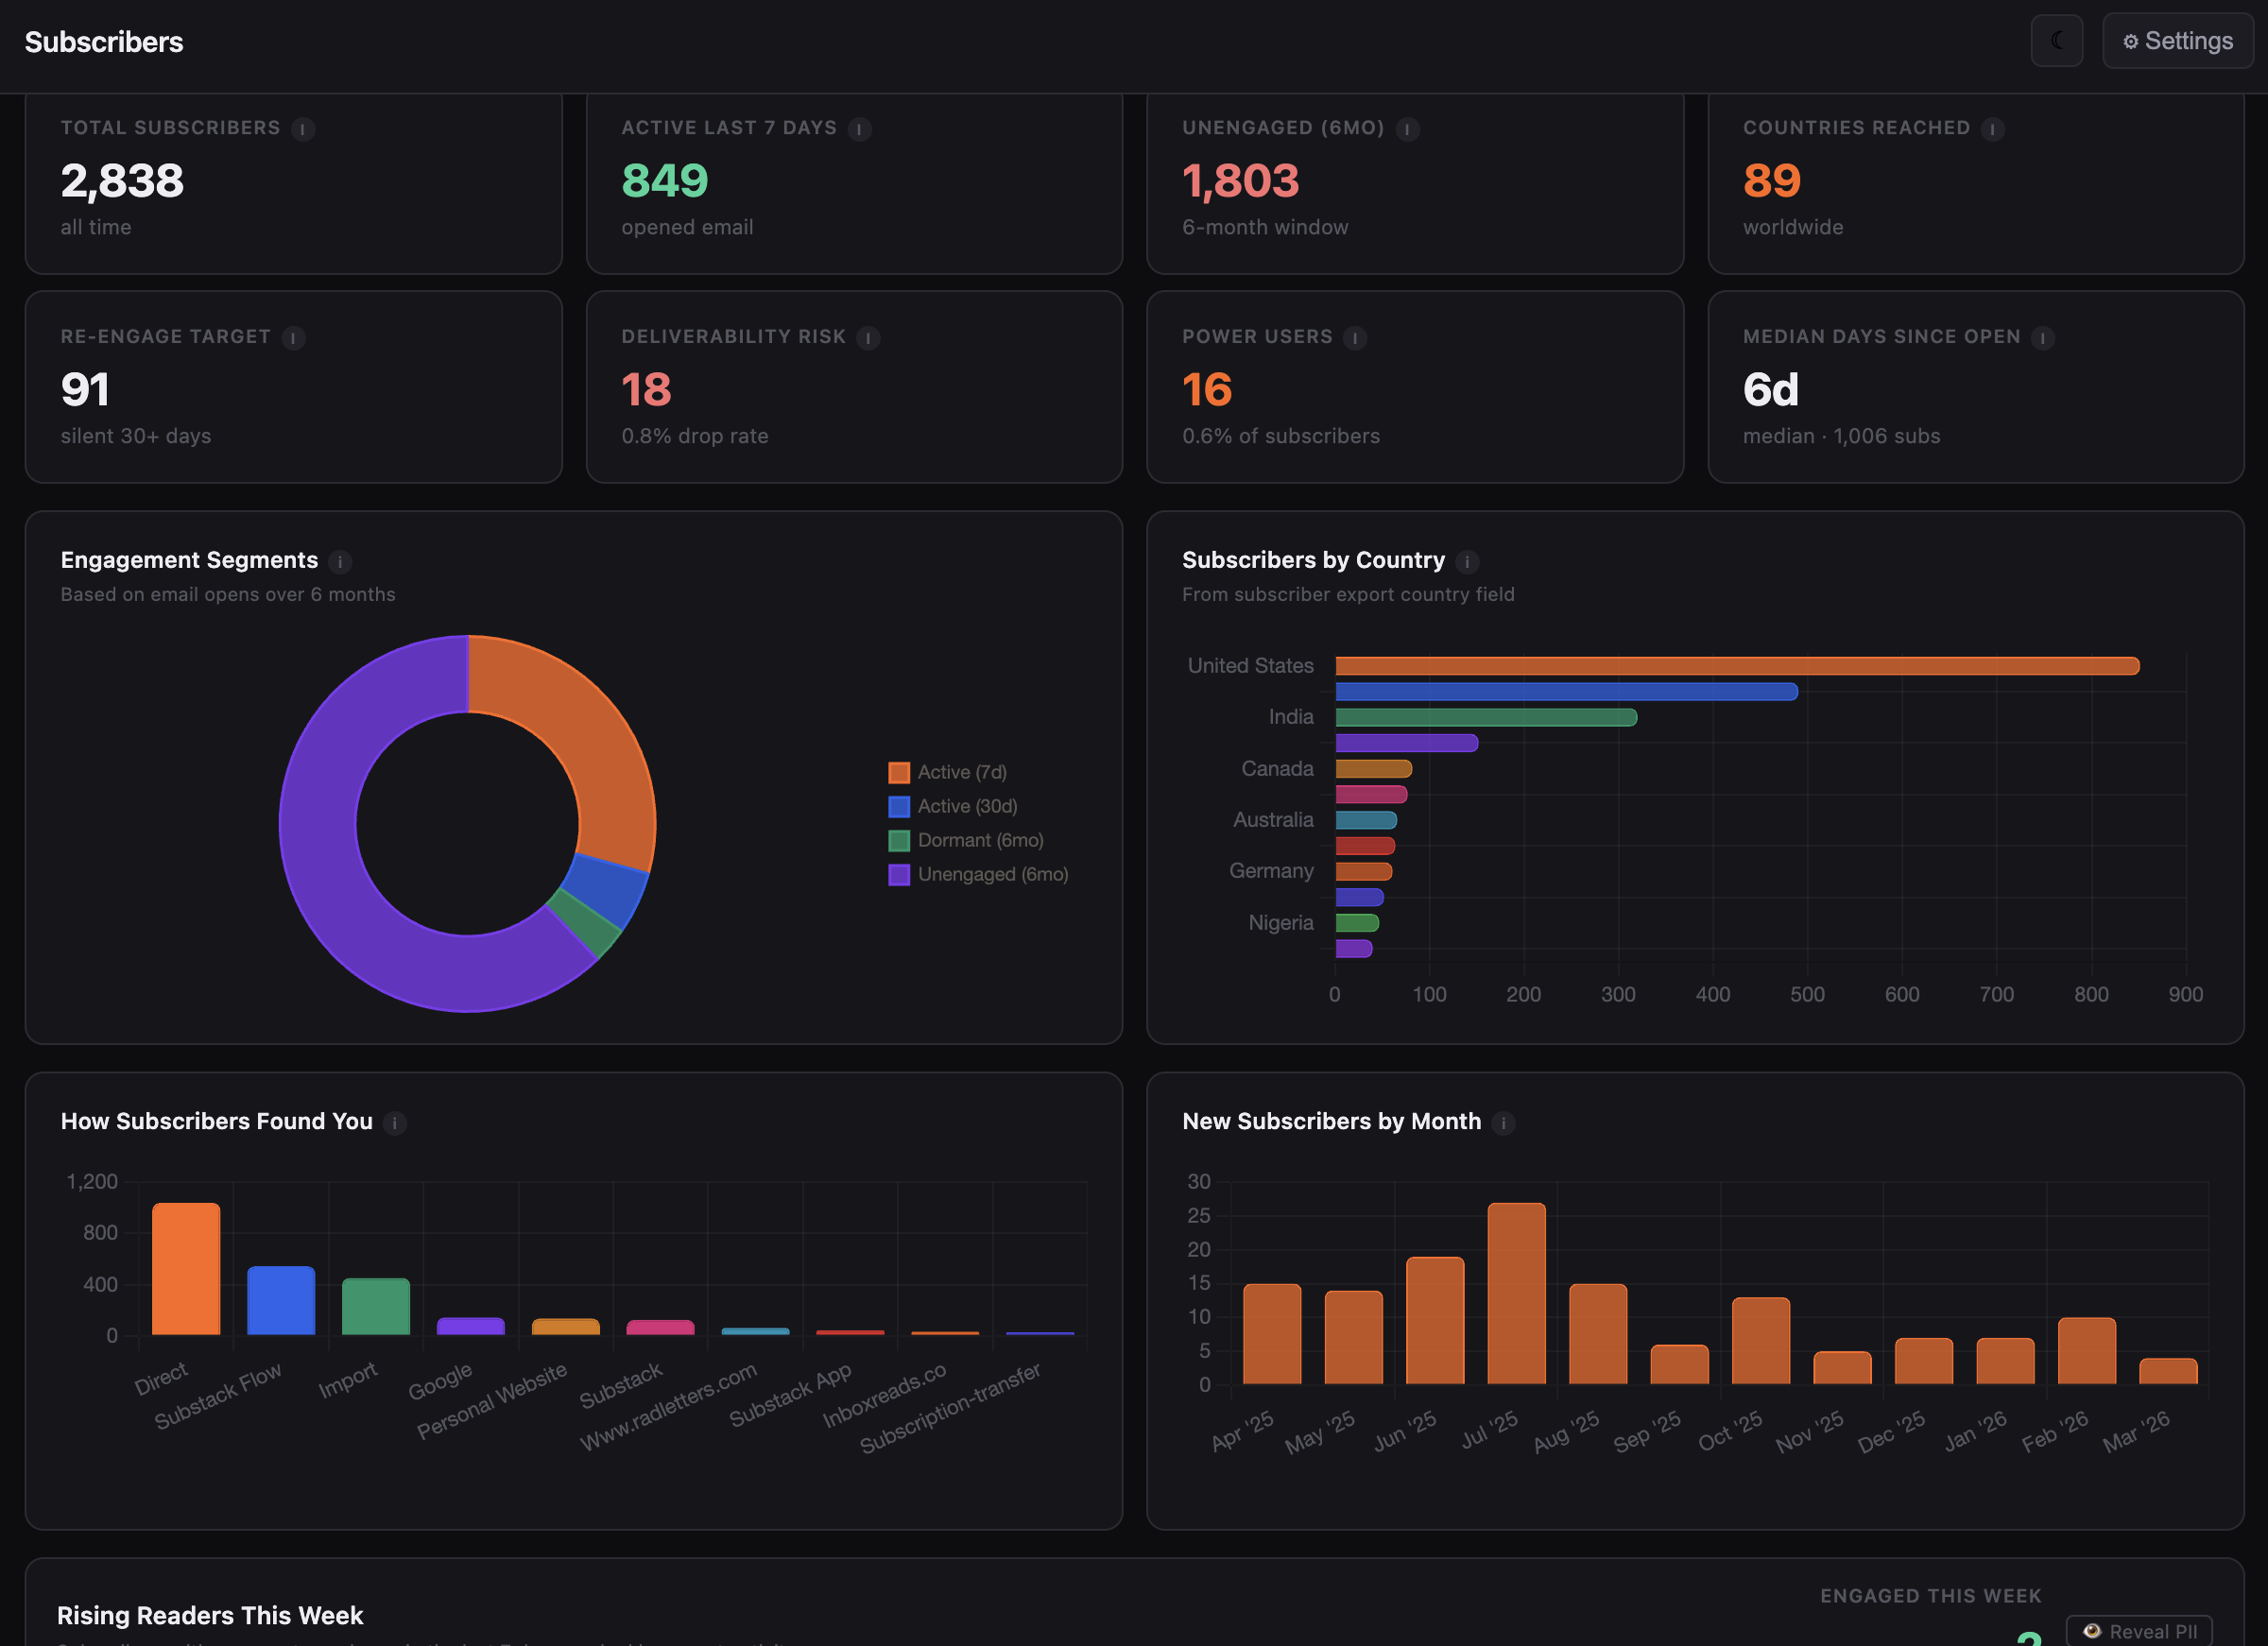
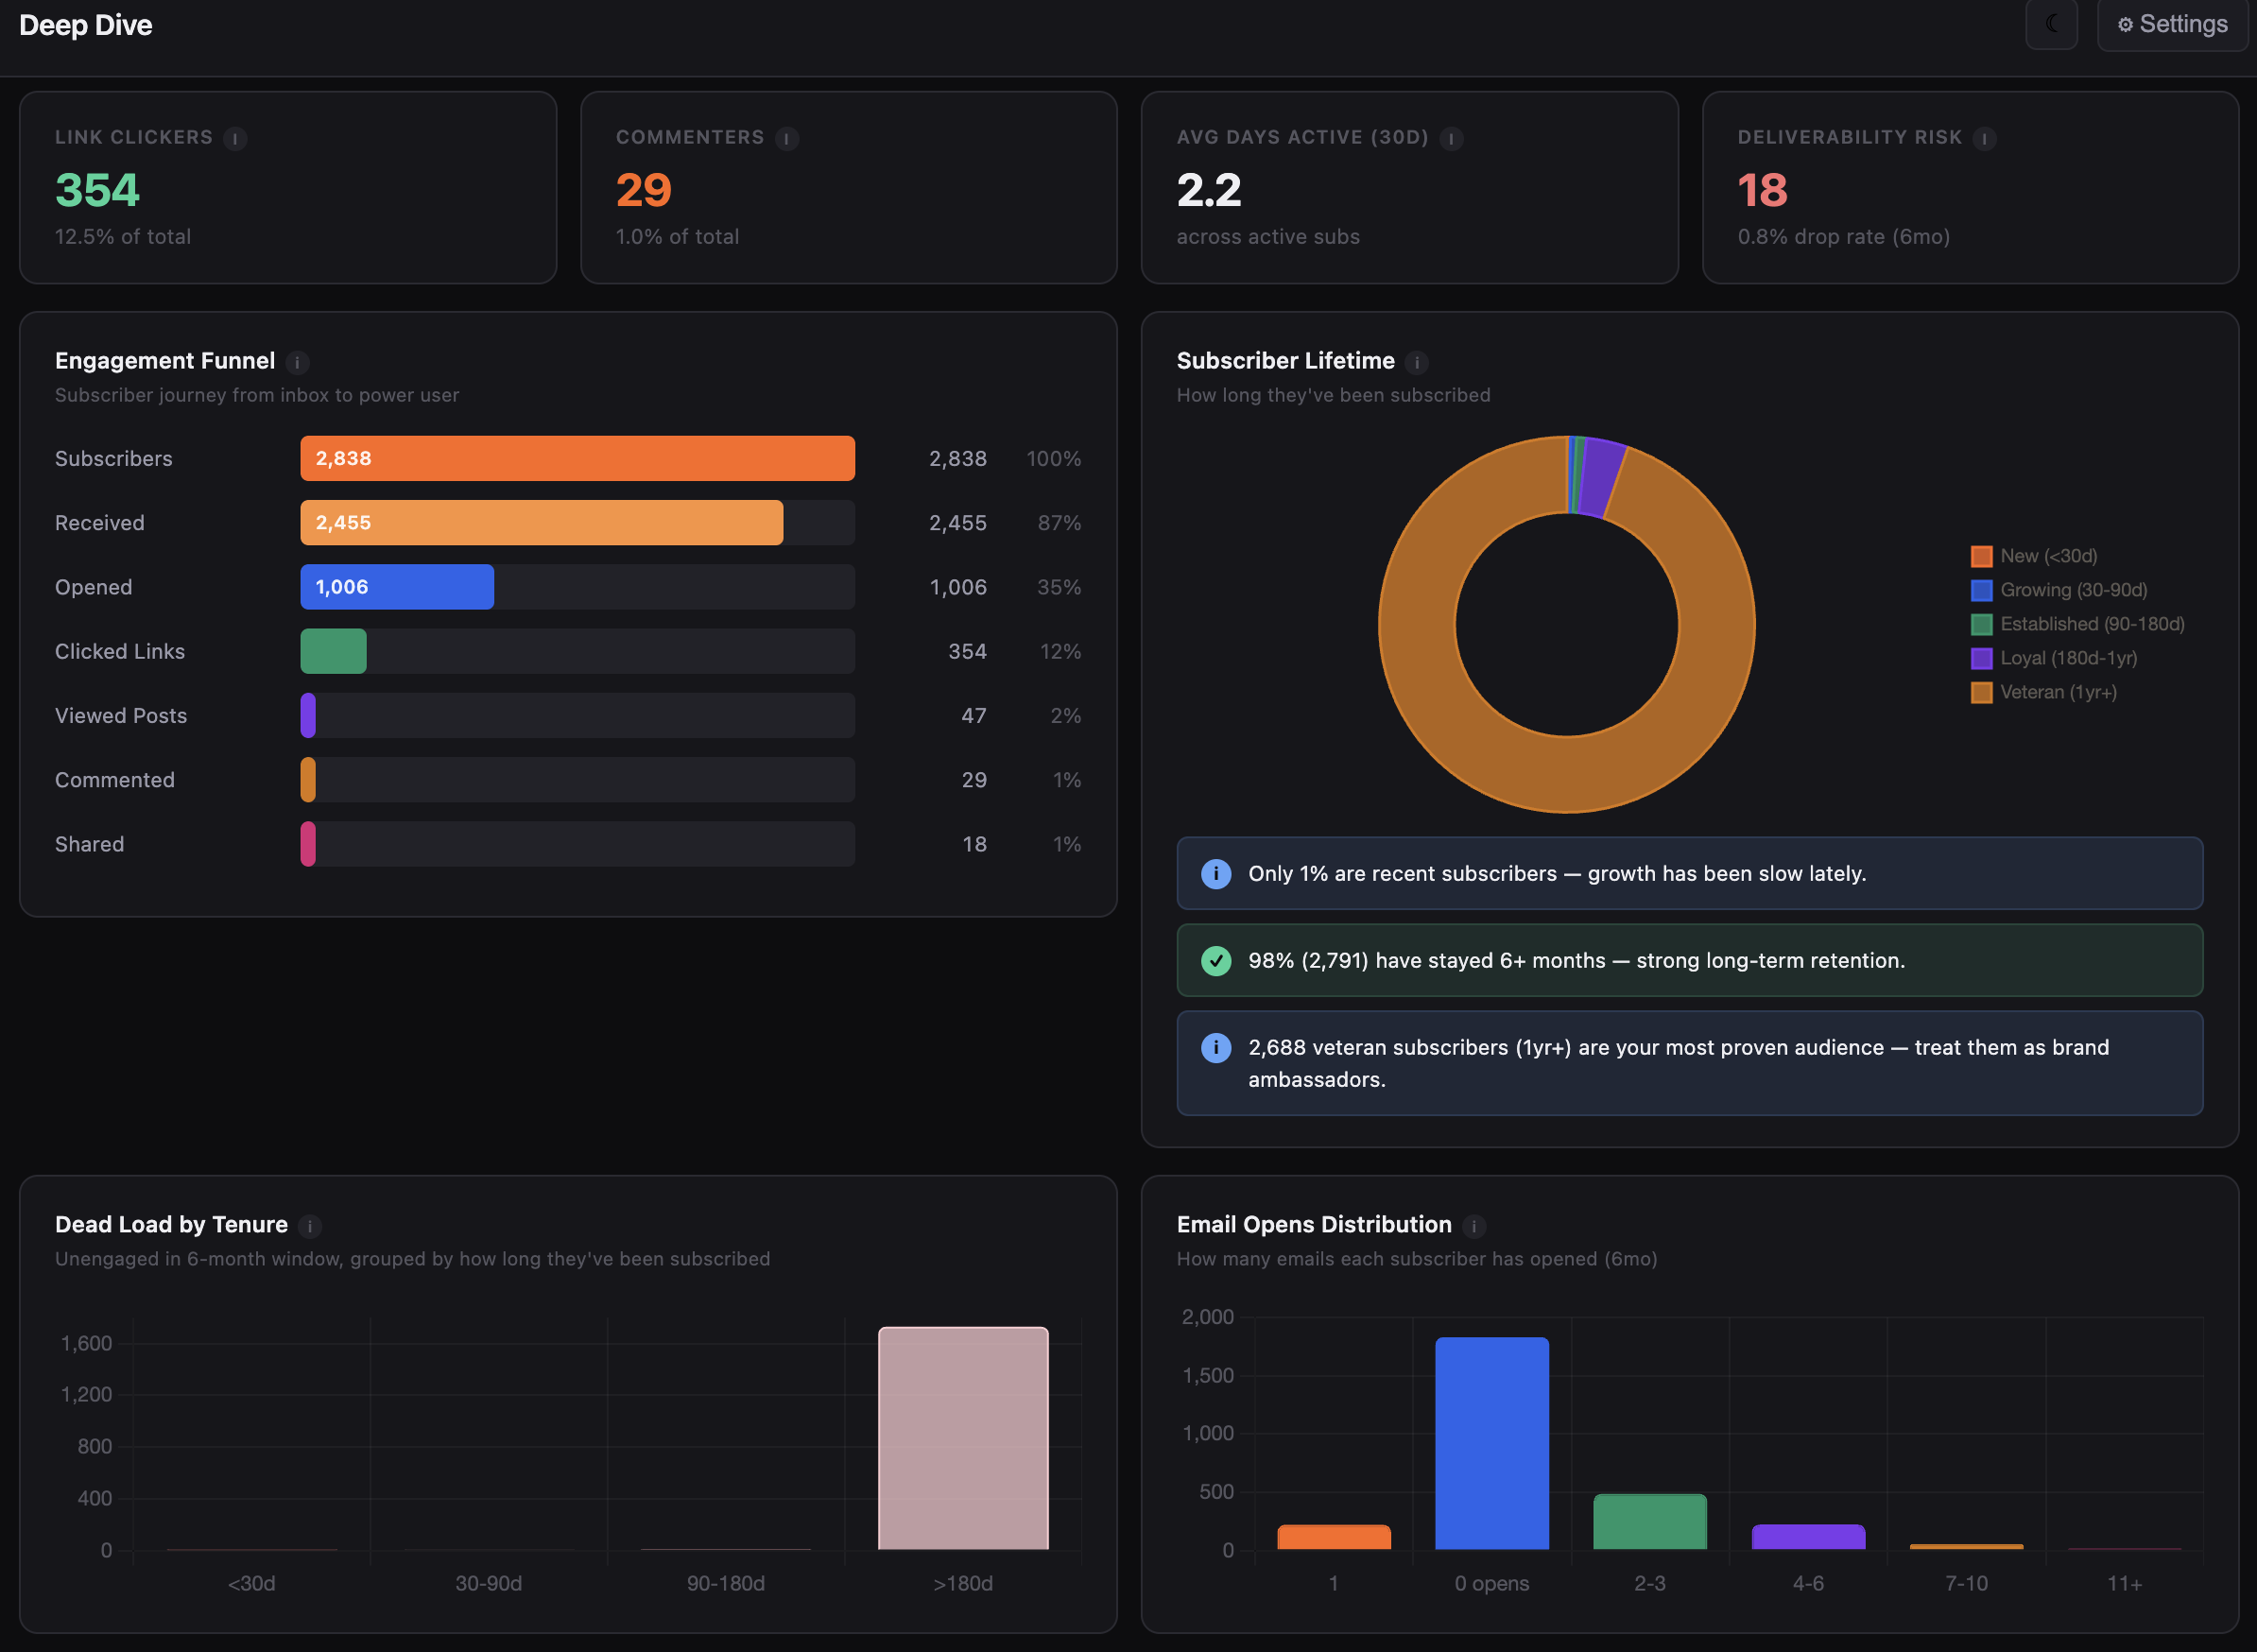
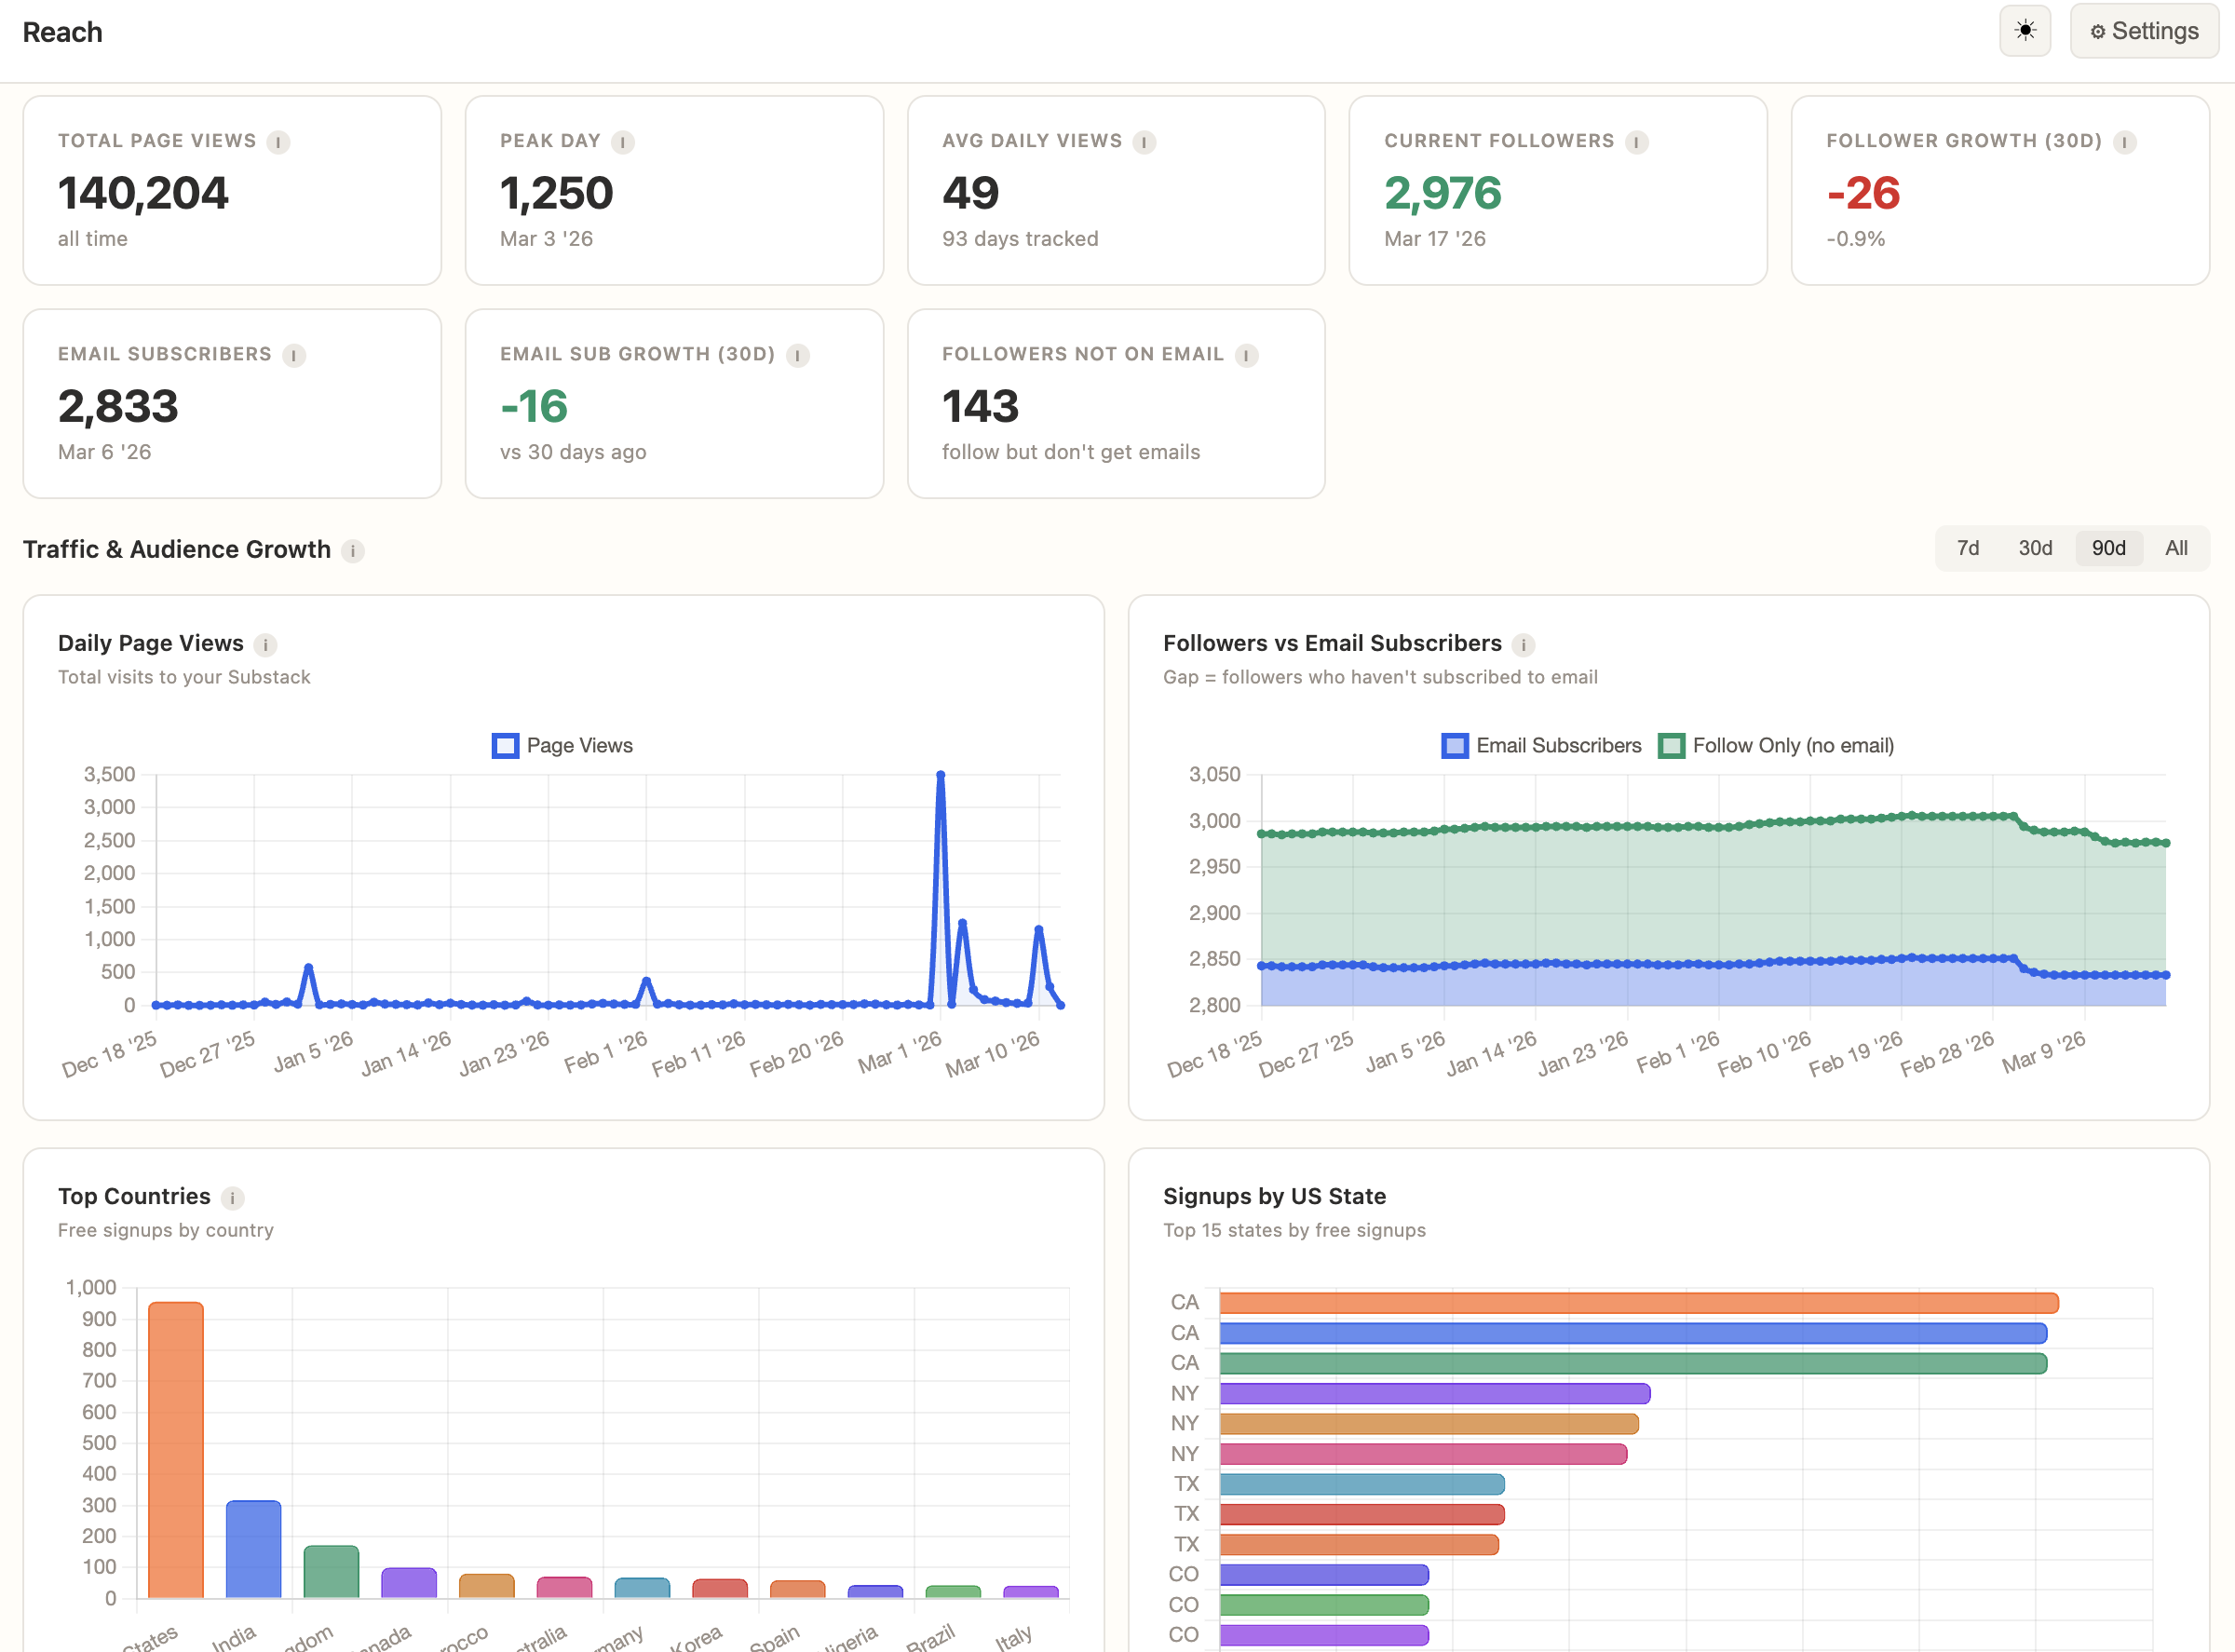
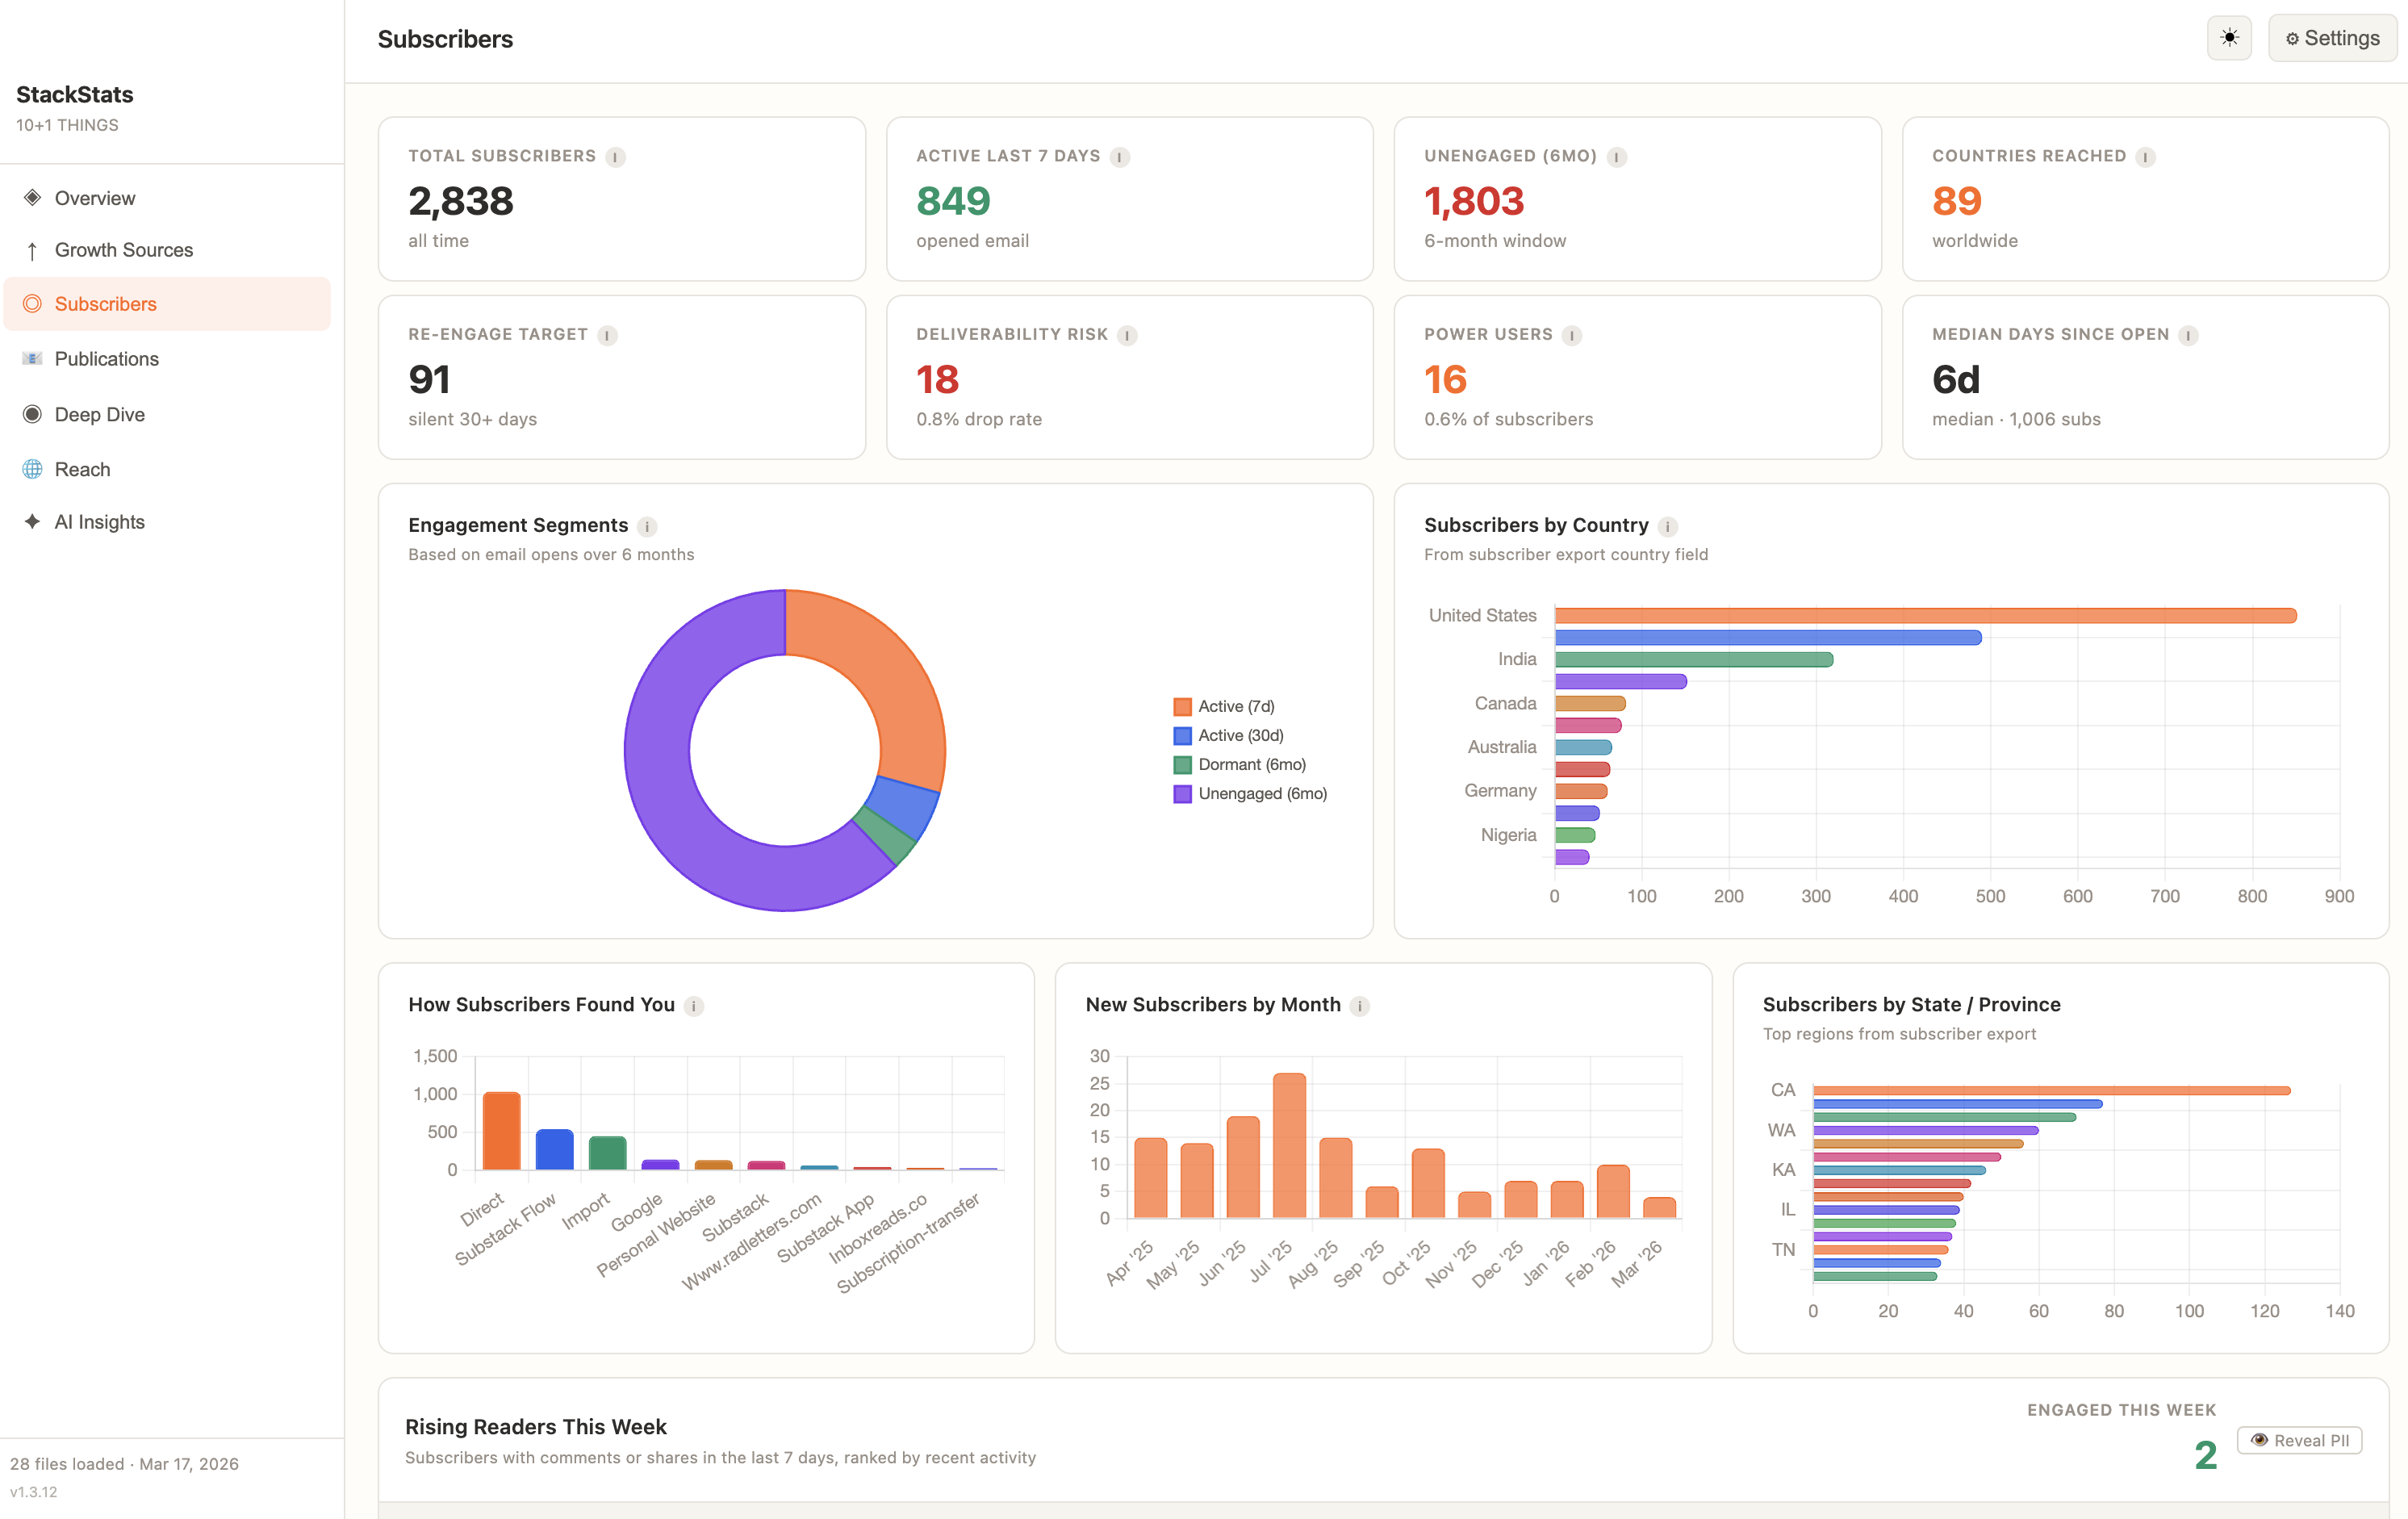
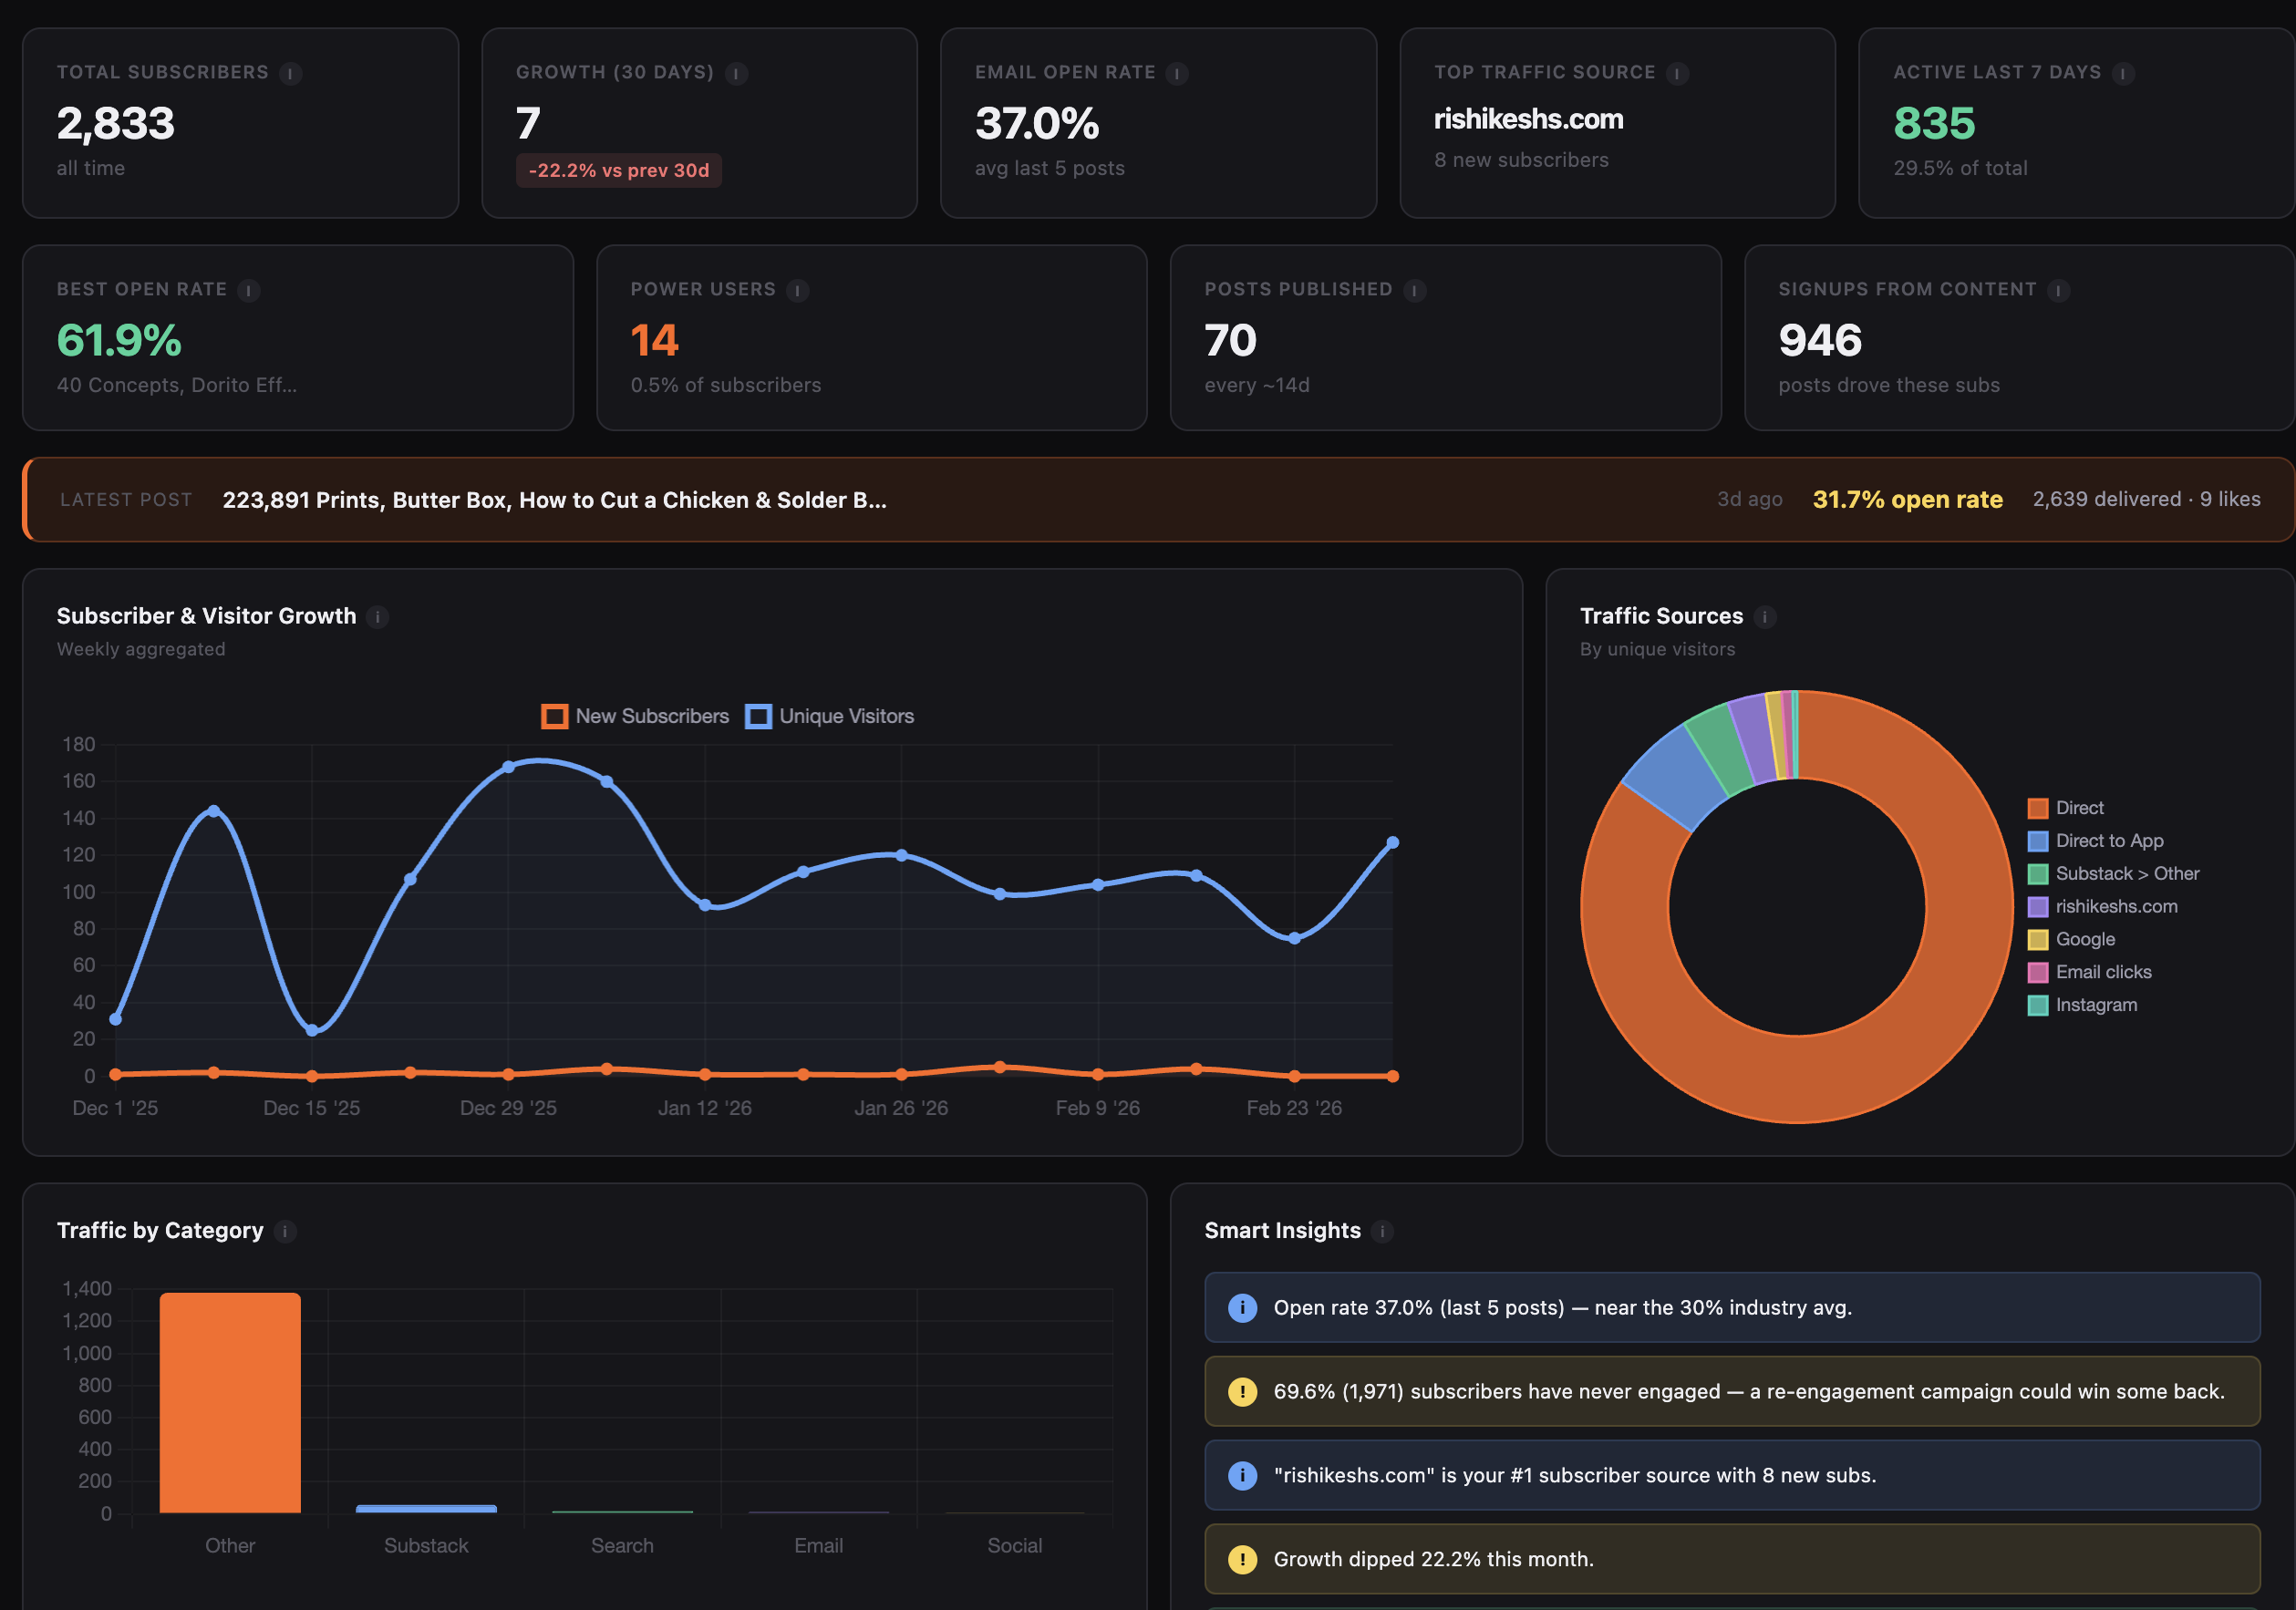
Connect once. See everything Substack hides.
No account · No internet · Works on Mac & Windows

180d Forecast
+347
subs by Oct '26
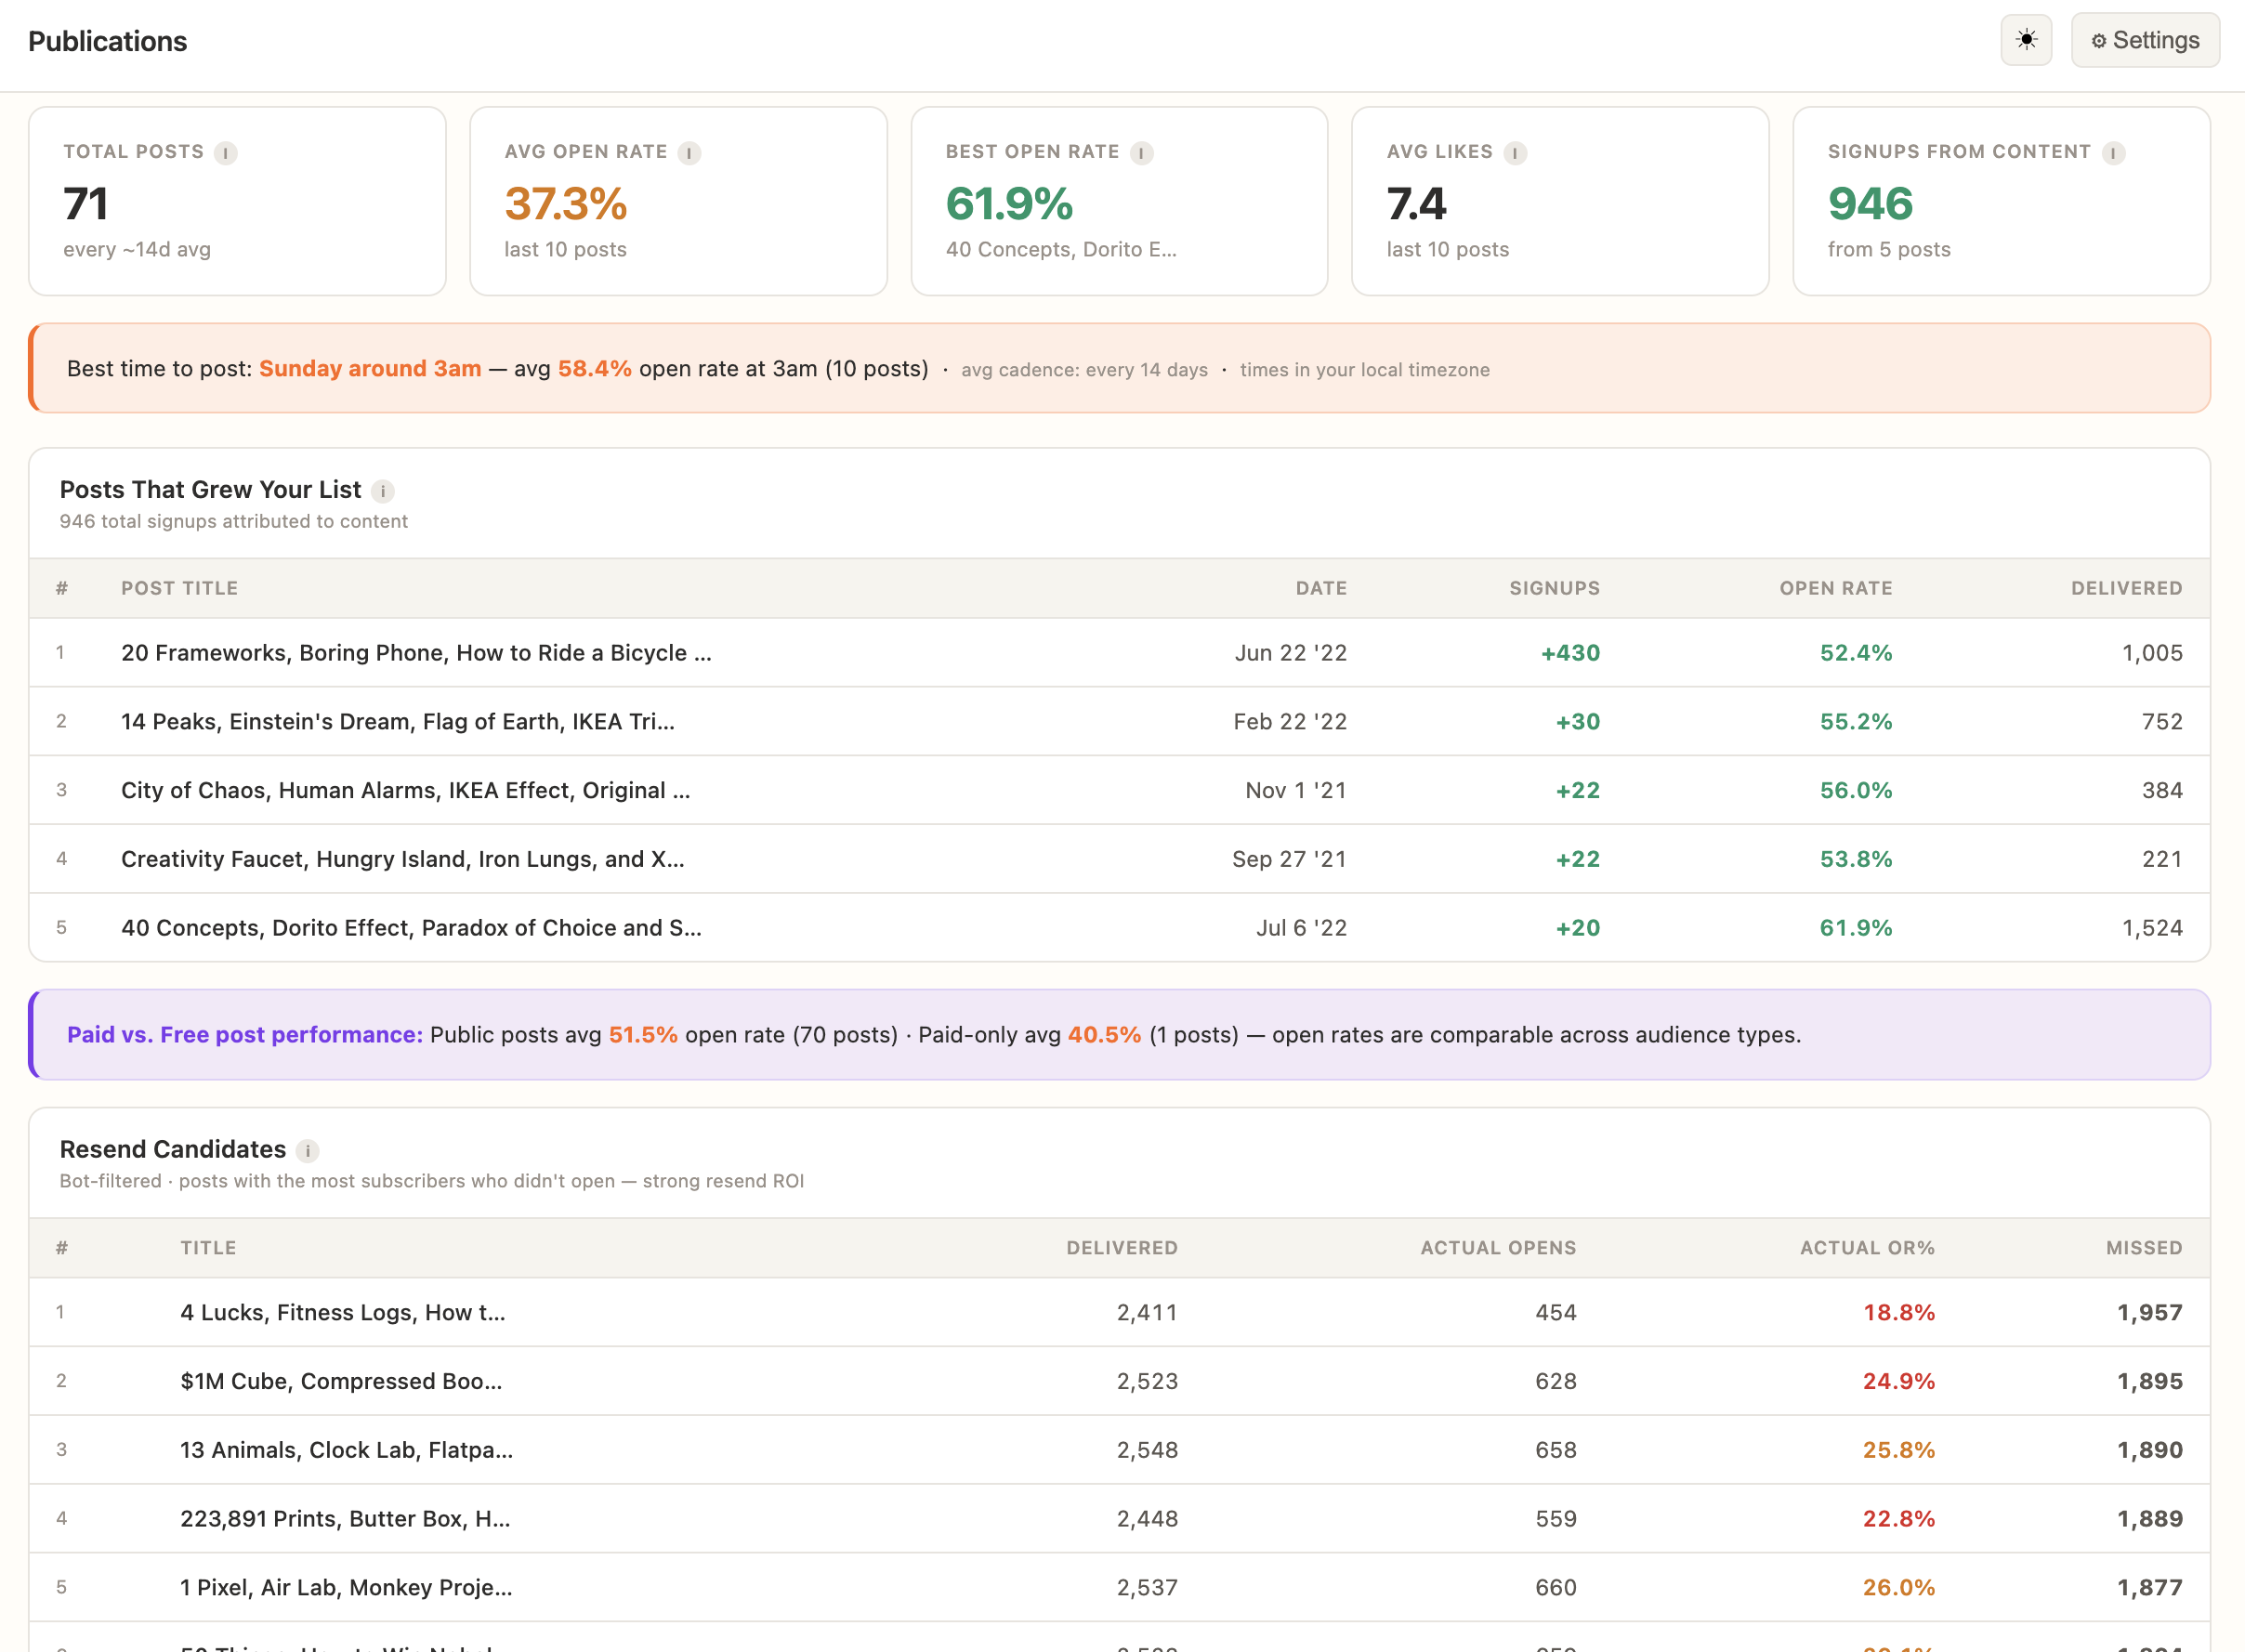
Best time to post
Sun 4am
55% avg open rate
Ready to upgrade
127 readers
High engagement
⚠ Churn risk
412
readers at risk
Click the card behind to switch